
Prometheus-Powered SAP Monitoring: Step-by-Step Installation Guide on Oracle 9 (Red Hat-Based System) for Complete Server Metrics and SAP/Hana Performance Insights
We are going to create a full prometheus sap monitoring stack composed of
- Prometheus Server
- Grafana
- node exporter (self monitoring)
- sap node exporter
💡 The NW RFC SDK 7.50 currently supports the following platforms and OS versions:
- AIX 7.1, 7.2, 7.3
- HP-UX 11.31 IA64 64bit
- Linux Red Hat EL 6 IA32 32bit
- Linux Red Hat EL 7, 8, 9 POWER LE 64bit
- Linux Red Hat EL 6, 7 POWER 64bit
- Linux Red Hat EL 6, 7, 8, 9 X86_64 64bit
- Linux Red Hat EL 6, 7, 8, 9 ZSERIES 64bit
- Linux SuSE SLES 11 IA32 32bit
- Linux SuSE SLES 12, 15 POWER LE 64bit
- Linux SuSE SLES 11 POWER 64bit
- Linux SuSE SLES 11, 12, 15 X86_64 64bit
- Linux SuSE SLES 11, 12, 15 ZSERIES 64bit
- Linux ORACLE OL 6, 7, 8, 9 X86_64 64bit
- Mac OS X 10.10, 10.11, 10.12, 10.13, 10.14, 10.15, 11, 12 X86_64 64bit
- Mac OS X 11, 12 ARM64 64bit
- Solaris/SPARC 10, 11 64bit
- Solaris/X64 10, 11 64bit
- Windows 7, 8.1, 10, 11 X86 32bit
- Windows 7, 8.1, 10, 11 X64 64bit
- Windows Server 2008 R2/X64 64bit
- Windows Server 2012 X64 64bit
- Windows Server 2012 R2/X64 64bit
- Windows Server 2016 LTSB X64 64bit
- Windows Server 2019 LTSC X64 64bit
- Windows Server 2022 LTSC X64 64bit
- IBM System i (aka AS/400, iSeries), versions V7R1 – V7R5
- IBM System i (aka AS/400, iSeries) in EBCDIC mode, versions V7R1 – V7R5
- IBM System z (aka OS/390, zSeries), versions 2.1 – 2.5
Support for the NW RFC SDK 7.50 will extend at least until December 31st, 2025.
System Package Update with Yum
yum update -y
The “yum update -y” command is a directive used in Linux-based systems, particularly those using the Yellowdog Updater, Modified (Yum) package manager. This command is designed to update all installed packages on the system to their latest available versions. The “-y” flag is added to automatically confirm and apply the updates without requiring user interaction, making it suitable for automation and batch processing. This command helps ensure that the operating system and installed software are equipped with the latest security patches, bug fixes, and feature enhancements, enhancing system stability and performance.
Creating a Prometheus Repository Configuration File
cat > /etc/yum.repos.d/prometheus.repo <<'EOF'
The “cat > /etc/yum.repos.d/prometheus.repo <<‘EOF'” command is used to create a new configuration file for Yum repositories dedicated to Prometheus. Here’s a breakdown of the components:
cat: Concatenate and display the content.>: Redirect the output to a file./etc/yum.repos.d/prometheus.repo: Specifies the path and filename where the new configuration file will be created. In this case, it’s in the directory that Yum uses to store repository configurations, and the file is named “prometheus.repo”.<<'EOF': This is a here document marker, indicating the start of a block of text. ‘EOF’ is the delimiter, and it signifies the end of the block.
[prometheus]
name=prometheus
baseurl=https://packagecloud.io/prometheus-rpm/release/el/$releasever/$basearch
repo_gpgcheck=1
enabled=1
gpgkey=https://packagecloud.io/prometheus-rpm/release/gpgkey
       https://raw.githubusercontent.com/lest/prometheus-rpm/master/RPM-GPG-KEY-prometheus-rpm
gpgcheck=1
metadata_expire=300
After running this command, the system prompts the user to input text for the configuration file. Whatever is entered until ‘EOF’ is treated as the content of the file. This is a common technique for quickly creating or modifying files from the command line.
EOFThe purpose of this specific command is to set up a Yum repository configuration for Prometheus, likely containing details such as the repository URL, name, and other settings necessary for Yum to retrieve and install Prometheus packages.
Updating Crypto Policies for SHA-1 Algorithm
update-crypto-policies --set DEFAULT:SHA1The “update-crypto-policies –set DEFAULT:SHA1” command is used to update the cryptographic policies on a Linux system, specifically setting the default policy for the SHA-1 (Secure Hash Algorithm 1) cryptographic hash function.
Breaking down the components:
update-crypto-policies: This is a command-line tool used in Linux environments to manage cryptographic policies.--set DEFAULT:SHA1: Specifies the action to be taken. In this case, it sets the default cryptographic policy to use the SHA-1 algorithm. This command might be used for compatibility with systems or applications that still rely on SHA-1, even though it’s generally considered insecure for certain cryptographic purposes due to vulnerabilities.
It’s important to note that the use of SHA-1 for cryptographic purposes is discouraged in modern security practices due to its susceptibility to collision attacks. The command may be employed in scenarios where compatibility requirements outweigh the security risks associated with SHA-1. Users should be cautious and consider more secure alternatives if possible.
restartInstalling Prometheus and Node Exporter with DNF
dnf -y install prometheus2 node_exporter
The “dnf -y install prometheus2 node_exporter” command is used in Linux systems employing the DNF (Dandified Yum) package manager to install Prometheus version 2 and Node Exporter.
Executing this command installs Prometheus and Node Exporter on the system, providing the necessary components for setting up a basic monitoring infrastructure. After installation, administrators typically configure Prometheus to scrape metrics from Node Exporter and other relevant sources to monitor system performance and health.
Editing Prometheus Configuration File
vi /etc/prometheus/prometheus.yml
In this file we add the local node exporter
# my global config
global:
  scrape_interval:     15s # Set the scrape interval to every 15 seconds. Default is every 1 minute.
  evaluation_interval: 15s # Evaluate rules every 15 seconds. The default is every 1 minute.
  # scrape_timeout is set to the global default (10s).

# Alertmanager configuration
alerting:
  alertmanagers:
  - static_configs:
    - targets:
      # - alertmanager:9093

# Load rules once and periodically evaluate them according to the global 'evaluation_interval'.
rule_files:
  # - "first_rules.yml"
  # - "second_rules.yml"

# A scrape configuration containing exactly one endpoint to scrape:
# Here it's Prometheus itself.
scrape_configs:
  # The job name is added as a label `job=<job_name>` to any timeseries scraped from this config.
  - job_name: 'prometheus'

    # metrics_path defaults to '/metrics'
    # scheme defaults to 'http'.

    static_configs:
    - targets: ['localhost:9090']

  # add : grab stats about the local machine by [node-exporter]
  - job_name: node
    static_configs:
      - targets: ['localhost:9100']
Enabling and Starting Prometheus and Node Exporter Services
systemctl enable --now prometheus node_exporter
Configuring Firewall Rules for Prometheus Service
firewall-cmd --add-service=prometheusThis command adds a firewall rule to allow traffic for the “prometheus” service. The firewall-cmd tool is used for configuring the firewall in Linux systems, and in this case, it is specifying that the firewall should permit incoming connections associated with the Prometheus service. This is crucial for allowing external access to Prometheus, typically on port 9090, where Prometheus provides its web interface.
firewall-cmd --runtime-to-permanentThis command makes the changes made with --add-service=prometheus permanent. The --runtime-to-permanent option in firewall-cmd is used to make runtime configurations permanent, ensuring that the firewall rules persist across reboots. This is important for maintaining consistent firewall settings and preserving access to the Prometheus service.
Install Grafana
dnf -y install grafana
The “dnf -y install grafana” command is used in Linux systems employing the DNF (Dandified Yum) package manager to install Grafana.
systemctl enable --now grafana-server
The “systemctl enable –now grafana-server” command is used in a Linux system employing the systemd init system to enable and start the Grafana server service.
firewall-cmd --add-port=3000/tcp
firewall-cmd --runtime-to-permanent
These commands will open necessary ports.
Check URLs
Congratulations! You have successfully set up a powerful monitoring stack with Grafana, Prometheus, and a local Node Exporter. This integrated solution allows you to collect and visualize metrics from your system and applications.
To access the Grafana web interface for creating insightful dashboards, navigate to http://<hostname or ip>:3000. Default credentials are admin/admin
Additionally, explore the metrics provided by the local Node Exporter at http://<hostname or ip>:9100, which exposes hardware and OS-level information. Please note that we did not open this port on the local firewall, if you want to test it you can add it temporarily:
firewall-cmd --add-port=9100/tcp 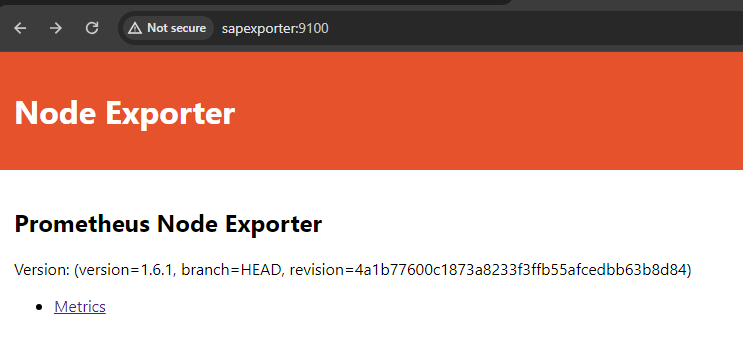
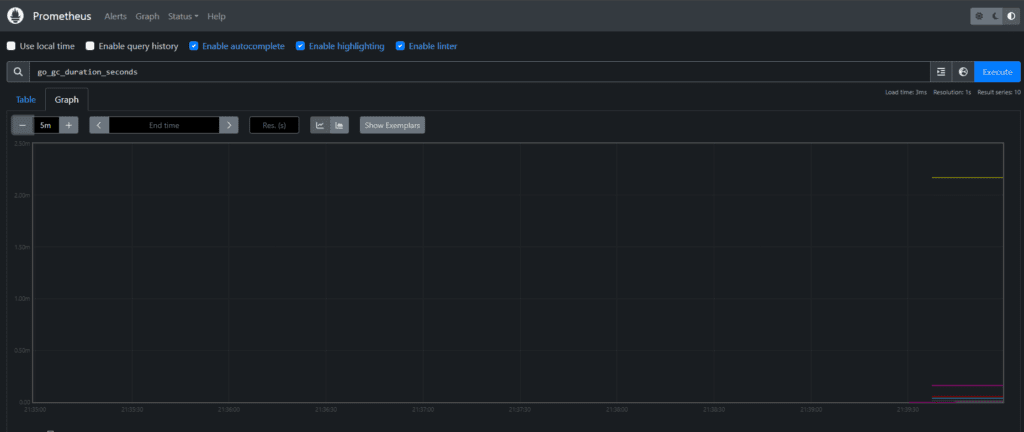
For Prometheus, the metrics endpoint can be reached at http://<hostname or ip>:9090, offering a centralized repository for collecting and querying metrics. These URLs provide convenient access points to monitor and analyze the health and performance of your system in real-time.
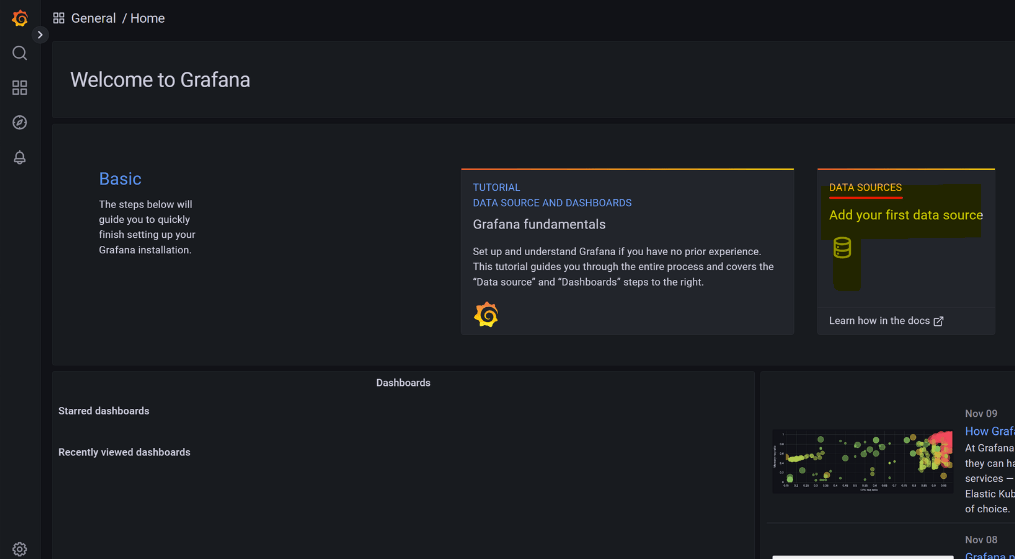
After setting our own password you can proceed with setting up the datasource connection with prometheus but clicking on “DATA SOURCES”
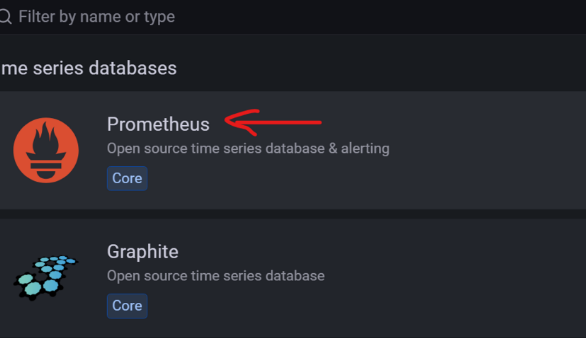
Select Prometheus
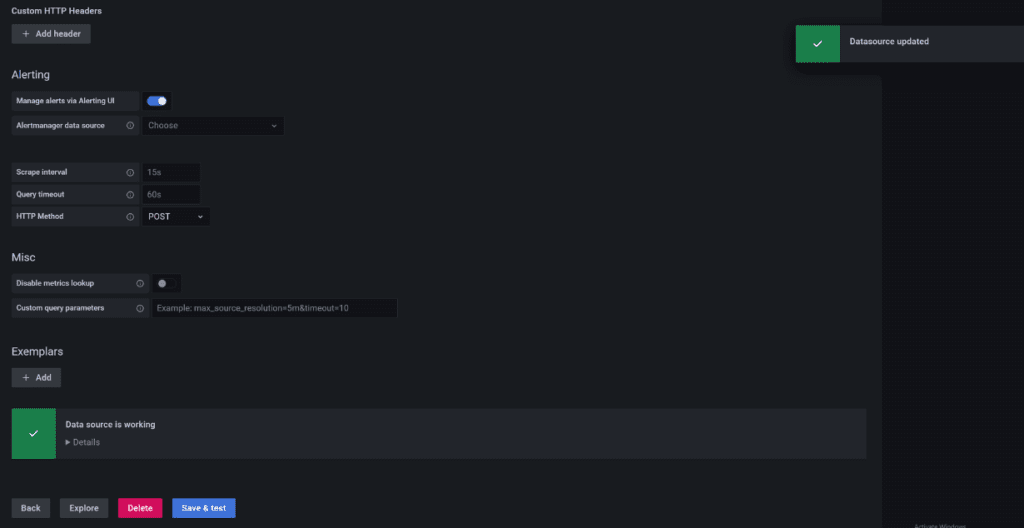
you will see that it suggests http://localhost:9090. Simply type it then save and test. A green check mark should appear.
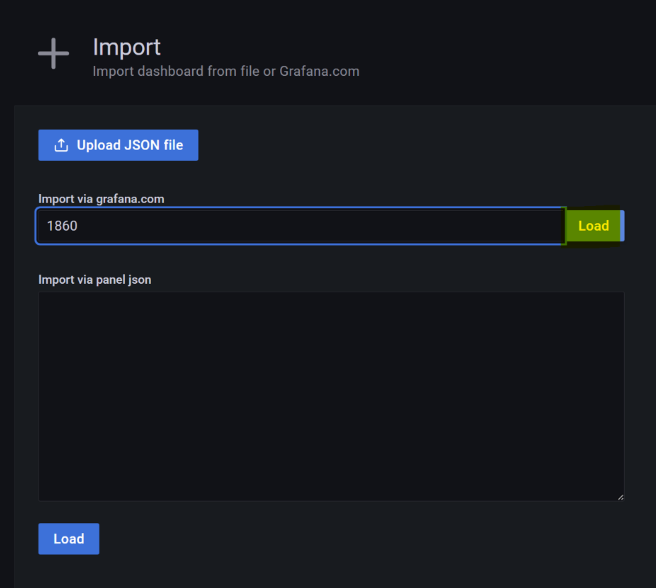
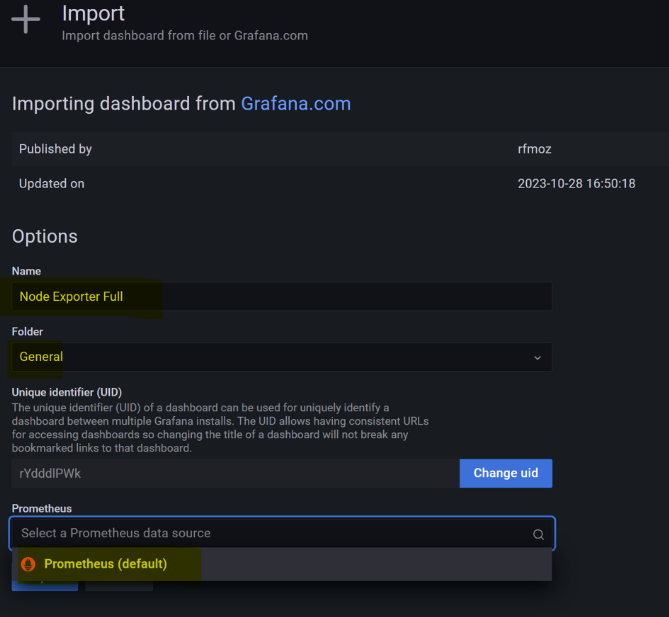
Installing Node Exporter Dashboard in Grafana
In the next step, we enhance our monitoring setup by installing a Node Exporter dashboard in Grafana. Utilizing the Grafana dashboard with ID 1860, available here, we import it into Grafana to visualize comprehensive metrics provided by the Node Exporter.
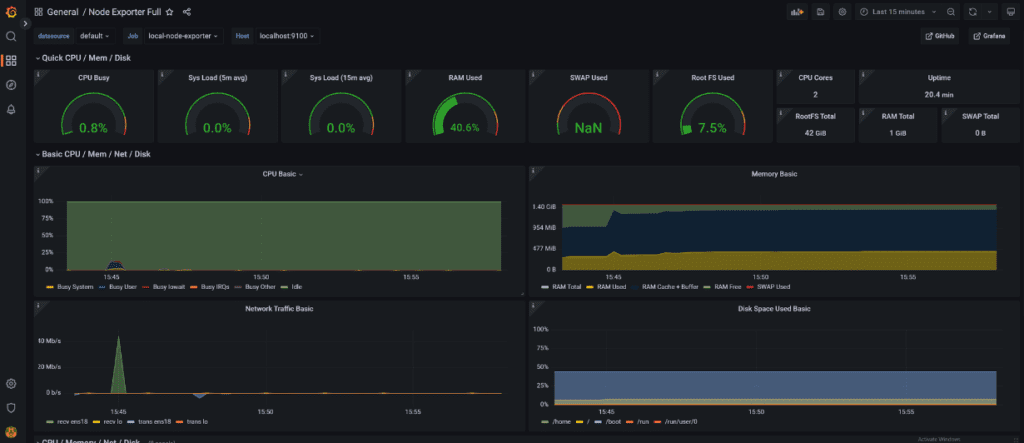
This dashboard offers a detailed overview of hardware and system-level metrics, facilitating a deeper understanding of your infrastructure’s performance. By importing this pre-configured dashboard, you gain immediate access to insightful visualizations, enabling efficient monitoring and troubleshooting of your environment. This step enhances the monitoring capabilities of your Grafana and Prometheus stack, providing a user-friendly interface to interpret Node Exporter metrics seamlessly.
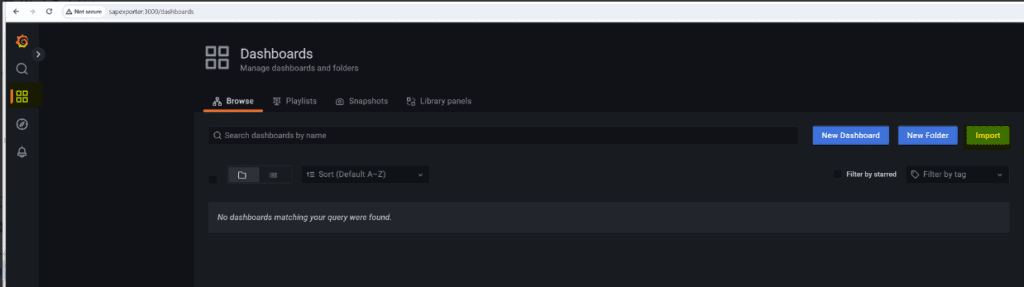
From the side menu click on the four boxes and then import
Select the datasource
Lower the time range to 5/15 minutes in the top right, and voilà: an improved monitoring experience. With this adjustment, you can now analyze and visualize more recent data.
Prometheus SAP Monitoring via sapnwrfc_exporter
I came across this excellent 2020 blog that needed a little tweak to make the installation procedure smoother. Essentially, this node exporter for SAP (sapnwrfc_exporter) was developed in Go and is provided via GitHub, but it does not include the SAP RFC SDK, which is mandatory for the agent to work. The SDK is only available from the official SAP site and will require a valid SAP S-User. You can install it on the same server; hence, I chose a supported SAP Linux distribution that doesn’t require a subscription to access its repository. Essentially, all the key details were outlined on the official GitHub page, but some things have changed, and not everyone is SAP-savvy.
In this step-by-step walkthrough, we demystify the process, ensuring you effortlessly set up and configure the sapnwrfc_exporter tool for efficient Prometheus integration.
SAP RFC SDK download and unpack
Once you have downloaded the appropriate SDK for your platform, unzip it on your server or client to ensure it’s ready for copying. On the target server, we need to create an SAP folder.
mkdir -p /usr/sap
Copy over the unzipped folder to the server under /usr/sap. Here is an example from the Command Prompt in Windows 11:
scp -r nwrfcsdk root@sapexporter:/usr/sap/
After copying the unzipped folder to the server under /usr/sap, it’s essential to set up environment variables for the user who will run the node exporter. These environment variables ensure that the SAP RFC SDK is correctly recognized and utilized by the system.
vi .bashrcThe command “vi .bashrc” is used to open the .bashrc file in the vi text editor. The .bashrc file is a shell script that is executed whenever a new terminal session is started for a user. It is commonly used to set environment variables, define aliases, and configure other aspects of the user’s shell environment. You will need to add these and the end of the file
export LD_LIBRARY_PATH="/usr/sap/nwrfcsdk/lib"
export CGO_LDFLAGS="-L /usr/sap/nwrfcsdk/lib"
export CGO_CFLAGS="-I /usr/sap/nwrfcsdk/include"
export CGO_LDFLAGS_ALLOW=.*
export CGO_CFLAGS_ALLOW=.*
After making changes to the .bashrc file, it’s advisable to log off and log back on to ensure that the new environment variables take effect.
# Install Go and Git using yum
sudo yum install go git -y

# Change directory to /usr/sap
cd /usr/sap

# Clone the sapnwrfc_exporter repository from GitHub
sudo git clone https://github.com/ulranh/sapnwrfc_exporter.git

# Change ownership of the sapnwrfc_exporter directory to the current user
# Alternatively, you can use chmod if needed, but changing ownership is often safer
sudo chown -R $(whoami) sapnwrfc_exporter

# Change directory to sapnwrfc_exporter
cd sapnwrfc_exporter

# Build the sapnwrfc_exporter Go program
go build -ldflags "-s -w" -o sapnwrfc_exporter
TOML file
As an essential step, you’ll need to provide a TOML configuration file for the SAP system. Here’s an example for a SAP system with SID ‘DEV.’ A TOML file is a structured configuration file commonly used for configuration management. Below is a basic template to help you get started:
[root@sapexporter ~]# cat /usr/sap/sapnwrfc_exporter/sapnwrfc_exporter.toml
[[metrics]]
  AllServers = false
  FunctionModule = "ENQUE_READ"
  Help = "sm12 help"
  MetricType = "gauge"
  Name = "sap_lock_entries"
  TagFilter = []

  [metrics.params]
    GARG = ""
    GCLIENT = ""
    GNAME = ""
    GUNAME = ""

  [metrics.tabledata]
    Table = "ENQ"

    [metrics.tabledata.rowcount]
      gclient = ["total","000","100","60"]

[[metrics]]
  AllServers = true
  FunctionModule = "SAPTUNE_GET_STORAGE_INFOS"
  Help = "SAP tune storage infos"
  MetricType = "gauge"
  Name = "sap_tune_storage_infos"
  TagFilter = []

  [metrics.fielddata]
    FieldValues = ["page_bufsz"]

[[metrics]]
  AllServers = true
  FunctionModule = "SAPTUNE_BUFFERED_PROGRAMS_INFO"
  Help = "SAP tune buffered programs info"
  MetricType = "gauge"
  Name = "sap_tune_programs_info"
  TagFilter = []

  [metrics.structuredata]
    ExportStructure = "INFO"
    StructureFields = ["prg_swap","prg_gen"]

[[metrics]]
  AllServers = true
  FunctionModule = "TH_WPINFO"
  Help = "sap process info"
  MetricType = "gauge"
  Name = "sap_processes"
  TagFilter = []

  [metrics.params]
    SRVNAME = ""

  [metrics.tabledata]
    Table = "WPLIST"

    [metrics.tabledata.rowcount]
      WP_STATUS = ["on hold","running","wait","total"]

[[systems]]
  Client = "100"
  Lang = "en"
  Name = "dev"
  Server = "192.168.1.124"
  Sysnr = "00"
  Tags = []
  Usage = "development"
  User = "DDIC"
Now that we have the TOML configuration file, the next step involves providing the password, which will be encrypted and included in the same file. For enhanced security, the sapnwrfc_exporter allows encryption of sensitive information. Please refer to the original README on GitHub for comprehensive options and details. Following the recommended practices ensures the safeguarding of your SAP system credentials and strengthens the overall security of your monitoring setup.
./sapnwrfc_exporter pw -s dev -c ./sapnwrfc_exporter.toml
To initiate a test run of the exporter, you can use the following command. If successful, you can proceed to create a Linux service directly.
./sapnwrfc_exporter web -c ./sapnwrfc_exporter.toml
Check if metrics show up locally using curl <http://localhost:9663/metrics>
Check if firewall is blocking eternal access, if required, update local firewall rules:
firewall-cmd --zone=public --add-port=9663/tcp firewall-cmd --permanent --zone=public --add-port=9663/tcpUpdate Prometheus with new endpoint
Update Prometheus to include a new endpoint by editing the Prometheus configuration file using the following command:
vi /etc/prometheus/prometheus.yml
# add : grab stats about the SAP
  - job_name: sap-dev-node-exporter
    static_configs:
      - targets: ['localhost:9663']
Restart prometheus
systemctl restart prometheus
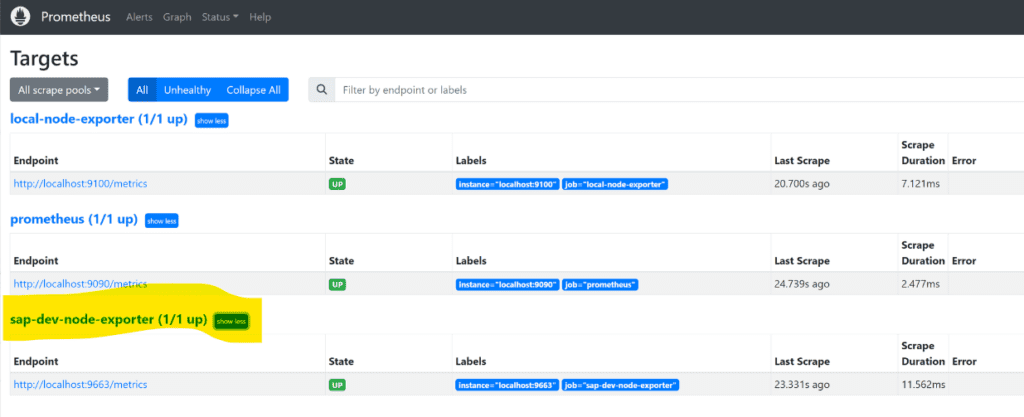
Now from targets you should see
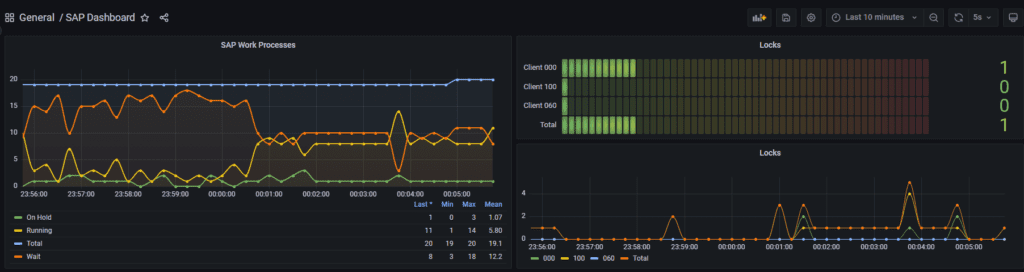
Now you can create and empty dashboard and add your own graphs and have fun. You’ll need to do some digging to add new checks but most basic monitoring can be done. A good exercise is to expand the default TOML to include also other statuses for disp+work processes and then expand to things like to number of active users and so on. The main issue I have this solution is that you might need assistance from a developer o functional guy to find and expand you SAP monitoring.
Here is an example:
As we wrap up, I want to express my sincere appreciation to all the subscribers of SystemWatchers on YouTube. Your support is the driving force behind the growth of our community, and I’m truly grateful for your engagement and enthusiasm. I’m excited to share that a comprehensive video tutorial is in the works, and one of the upcoming topics will delve into monitoring HANA systems. Your feedback and ideas are invaluable, so if you have any suggestions or specific topics you’d like to see covered in future videos, please feel free to share them in the comments section. Thank you for being a part of SystemWatchers, and stay tuned for more exciting content ahead!
SAP Hana Node Exporter Install and Setup
Consider using the existing directory for your SAP exporter to maintain consistency. In this case, the following commands can be utilized:
# Navigate to the SAP directory
cd /usr/sap

# Clone the SAP exporter repository
git clone https://github.com/ulranh/hana_sql_exporter.git

# Move into the cloned directory
cd hana_sql_exporter

# Build the exporter
go build
Next, let’s create a TOML configuration file within the /usr/sap/hana_sql_exporter directory to define the settings for the HANA SQL Exporter:
vi hana_sql_exporter.toml[[metrics]]
Help = "Status of last hana backup."
MetricType = "gauge"
Name = "hdb_backup_status"
SQL = "select (case when state_name = 'successful' then 0 when state_name = 'running' then 1 else -1 end) as val, entry_type_name as type from SYS.m_backup_catalog where entry_id in (select max(entry_id) from m_backup_catalog group by entry_type_name)"
SchemaFilter = []
TagFilter = []
[[metrics]]
Help = "Sap jobs with status cancelled/aborted (today)"
MetricType = "counter"
Name = "hdb_cancelled_jobs"
SQL = "select count(*) from <SCHEMA>.tbtco where enddate=current_utcdate and status='A'"
SchemaFilter = ["sapabap1","sapabap","sapewm"]
TagFilter = ["abap"]
[[Metrics]]
Name = "hdb_backup_status"
Help = "Status of last hana backup."
MetricType = "gauge"
TagFilter = []
SchemaFilter = ["sys"]
SQL = "select (case when state_name = 'successful' then 0 when state_name = 'running' then 1 else -1 end), entry_type_name as type from <SCHEMA>.m_backup_catalog where entry_id in (select max(entry_id) from m_backup_catalog group by entry_type_name)"
[[Metrics]]
Name = "hdb_replication_status"
Help = "Status of system replication."
MetricType = "gauge"
TagFilter = []
SchemaFilter = ["sys"]
SQL = "select top 1 (case when replication_status = 'active' then 1 when replication_status = 'error' then -1 else 0 end) from <SCHEMA>.m_service_replication"
[[Metrics]]
Name = "hdb_table_locks"
Help = "Hana table locks."
MetricType = "gauge"
TagFilter = []
SchemaFilter = ["sys"]
SQL = "select count(*) from <SCHEMA>.m_table_locks"
[[Metrics]]
Name = "hdb_blocked_transactions"
Help = "Hana blocked transactions."
MetricType = "gauge"
TagFilter = []
SchemaFilter = ["sys"]
SQL = "select count(*) from <SCHEMA>.m_blocked_transactions"
[[Metrics]]
Name = "hdb_allocated_rowstore_size"
Help = "Hana - allocated rowstore size"
MetricType = "gauge"
TagFilter = []
SchemaFilter = ["sys"]
SQL = "select allocated_size,port from <SCHEMA>.m_rs_memory where category='TABLE'"
[[Metrics]]
Name = "hdb_active_connections"
Help = "Active Hana connections per service"
MetricType = "gauge"
TagFilter = []
SchemaFilter = ["sys"]
SQL = "select COUNT(IFNULL(C.CONNECTION_STATUS, 'IDLE')) as connections, S.service_name as service FROM <SCHEMA>.M_CONNECTIONS C inner join <SCHEMA>.M_SERVICES S on C.PORT = S.PORT WHERE C.LOGICAL_CONNECTION_ID = C.CONNECTION_ID AND C.OWN = 'FALSE' group by S.service_name"
[[Metrics]]
Name = "hdb_active_status"
Help = "Check if hana db tenant is active"
MetricType = "gauge"
TagFilter = []
SchemaFilter = ["sys"]
SQL = "select top 1 (case when active_status = 'YES' then 1 else -1 end), database_name from <SCHEMA>.m_databases"
[[Metrics]]
Name = "hdb_orders_day_total"
Help = "SAP orders of the current day separated in types"
MetricType = "counter"
TagFilter = ["abap", "erp"]
SchemaFilter = ["sapabap1", "sapabap","sapewm"]
SQL = "select sum(1),auart from <SCHEMA>.vbak where erdat = CURRENT_UTCDATE group by auart"
[[Metrics]]
Name = "hdb_new_orders_day_total"
Help = "SAP new orders of the current day separated in sales units"
MetricType = "counter"
TagFilter = ["abap", "erp"]
SchemaFilter = ["sapabap1", "sapabap","sapewm"]
SQL = "select sum(cast(netwr as double)),waerk,vkorg from <SCHEMA>.vbak where erdat = CURRENT_UTCDATE group by waerk,vkorg"
[[Metrics]]
Name = "hdb_smq1_hanging_queues"
Help = "SMQ1 - Hanging Outbound Queues"
MetricType = "gauge"
TagFilter = ["abap"]
SchemaFilter = ["sapabap1", "sapabap","sapewm"]
SQL = "select count(*) from <SCHEMA>.trfcqout where qstate not in ('READ','READY')"
[[Metrics]]
Name = "hdb_oldest_backup_days"
Help = "Oldest Backup found in backup_catalog."
MetricType = "gauge"
TagFilter = []
SchemaFilter = ["sys"]
Sql = "SELECT DAYS_BETWEEN(MIN(SYS_START_TIME), CURRENT_TIMESTAMP) OLDEST_BACKUP_DAYS FROM <SCHEMA>.M_BACKUP_CATALOG"
[[Metrics]]
Name = "hdb_version"
Help = "Hana database version."
MetricType = "gauge"
TagFilter = []
SchemaFilter = ["sys"]
Sql = "select top 1 DAYS_BETWEEN(START_TIME, CURRENT_TIMESTAMP) as days, version from <SCHEMA>.M_DATABASE"
[[Metrics]]
Name = "hdb_cancelled_jobs"
Help = "Sap jobs with status cancelled/aborted (today)"
MetricType = "counter"
TagFilter = ["abap"]
SchemaFilter = ["sapabap1", "sapabap","sapewm"]
Sql = "select count(*) from <SCHEMA>.tbtco where enddate=current_utcdate and status='A'"
[[Metrics]]
Name = "hdb_completed_jobs"
Help = "Sap jobs with status completed (today)"
MetricType = "counter"
TagFilter = ["abap"]
SchemaFilter = ["sapabap1", "sapabap","sapewm"]
Sql = "select count(*) from <SCHEMA>.tbtco where enddate=current_utcdate and status='F'"
[[Metrics]]
Name = "hdb_active_jobs"
Help = "Sap jobs with status active"
MetricType = "gauge"
TagFilter = ["abap"]
SchemaFilter = ["sapabap1", "sapabap","sapewm"]
Sql = "select count(*) from <SCHEMA>.tbtco where status='R'"
[[Metrics]]
Name = "hdb_ready_jobs"
Help = "Sap jobs with status ready"
MetricType = "gauge"
TagFilter = ["abap"]
SchemaFilter = ["sapabap1", "sapabap","sapewm"]
Sql = "select count(*) from <SCHEMA>.tbtco where status='Y'"
[[tenants]]
ConnStr = "Host-012:39641"
Name = "tst"
Tags = ["cockpit","tst"]
User = "SYSTEM"Save Password for the connection
./hana_sql_exporter pw -t tst -c ./hana_sql_exporter.tomlCheck if the service starts
./hana_sql_exporter web --config ./hana_sql_exporter.toml --timeout 5Curl http://localhost:9658/metrics and check if metrics “hdb” are generated.
Open firewall ports if necessary
firewall-cmd --zone=public --add-port=9658/tcp
firewall-cmd --permanent --zone=public --add-port=9658/tcp
Create a Linux Service for auto start on boot
vi /etc/systemd/system/hana_sql_exporter.service[Unit]
Description=HANA SQL Exporter Service
After=network.target
[Service]
Type=simple
User=root
WorkingDirectory=/usr/sap/hana_sql_exporter
ExecStart=/usr/sap/hana_sql_exporter/hana_sql_exporter web --config ./hana_sql_exporter.toml --timeout 5
Restart=always
[Install]
WantedBy=multi-user.targetStart and enable services
systemctl daemon-reload
systemctl start hana_sql_exporter
systemctl enable hana_sql_exporter
systemctl status hana_sql_exporter
If it doesn’t start it is probable SELinux is preventing the execution of /usr/sap/hana_sql_exporter/hana_sql_exporter by the systemd service.
hana_sql_exporter might have an incorrect SELinux security context label. You can try running the restorecon command as suggested to set the correct label:
/sbin/restorecon -v /usr/sap/hana_sql_exporter/hana_sql_exportersystemctl restart hana_sql_exporterNow that the service is available externally we can add the hana node exporter as a target to our prometheus server configuration file and restart the service.
vi /etc/prometheus/prometheus.yml....
- job_name: 'sap-hana-node-exporter-example'
scrape_interval: 5s
static_configs:
- targets: ['localhost:9658']
labels: {'instance': 'hana-exporter-example'}
systemctl restart prometheusNow via Grafana you can graph Hana metrics.


Very nice post. I certainly love this website.
Keep writing!