How to Install Prometheus and Grafana on Windows with TLS 1.3
Welcome to this comprehensive guide on installing Prometheus and Grafana on a Windows system with TLS 1.3. Prometheus, an open-source systems monitoring and alerting toolkit, and Grafana, a multi-platform open-source analytics and interactive visualization web application, are powerful tools for managing and visualizing time series data.
In this guide, we will walk you through the process of setting up these tools on a Windows environment. We will also ensure that the communication is secured using the latest Transport Layer Security (TLS) protocol version 1.3.
TLS 1.3 provides enhanced security and improved performance compared to its predecessors, making it an excellent choice for safeguarding sensitive data.
Whether you’re a seasoned system administrator or a beginner looking to expand your knowledge, this guide will provide you with the steps and insights needed to successfully install and configure Prometheus and Grafana with TLS 1.3 on Windows.
Let’s get started!
Downloads:
We will proceed with the installation of Prometheus and Grafana by downloading the most recent binary versions directly from their respective official websites. Following this, we will configure both applications to utilize a dedicated hard drive specifically for the storage of data and configuration files. This approach ensures optimal performance and organization of our system monitoring setup.
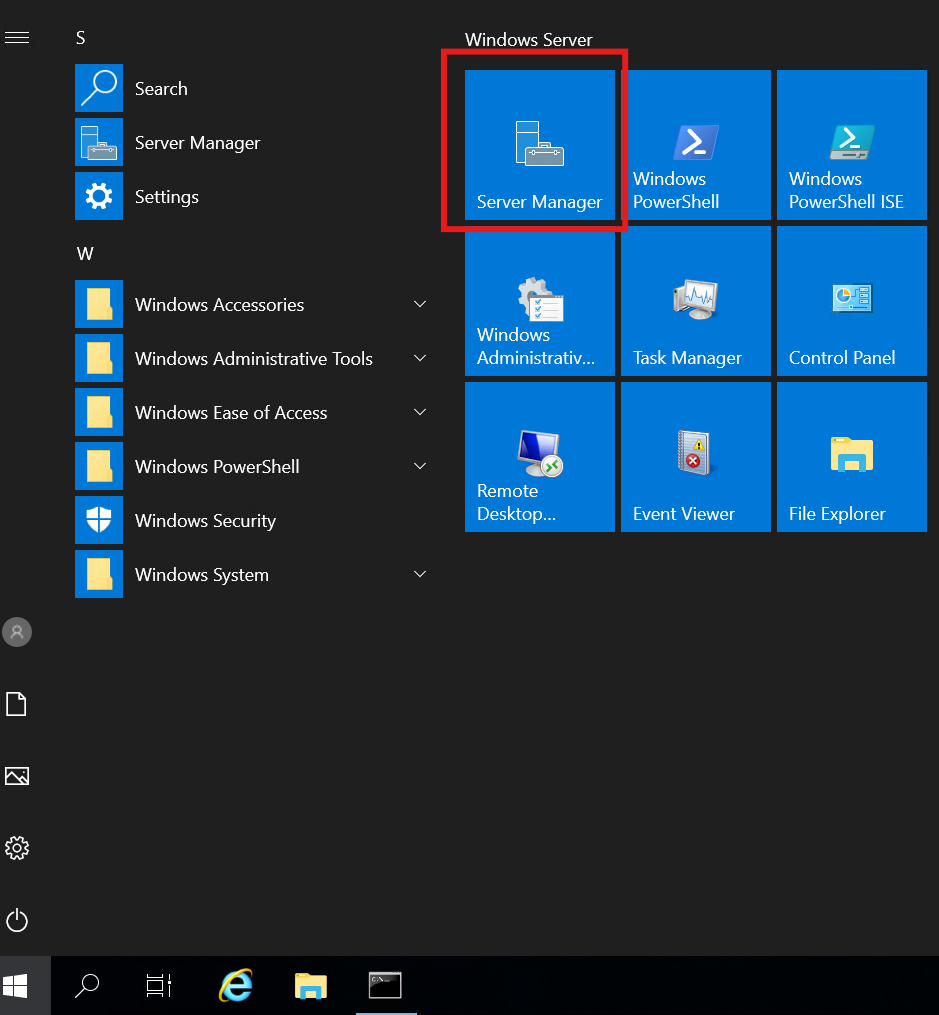
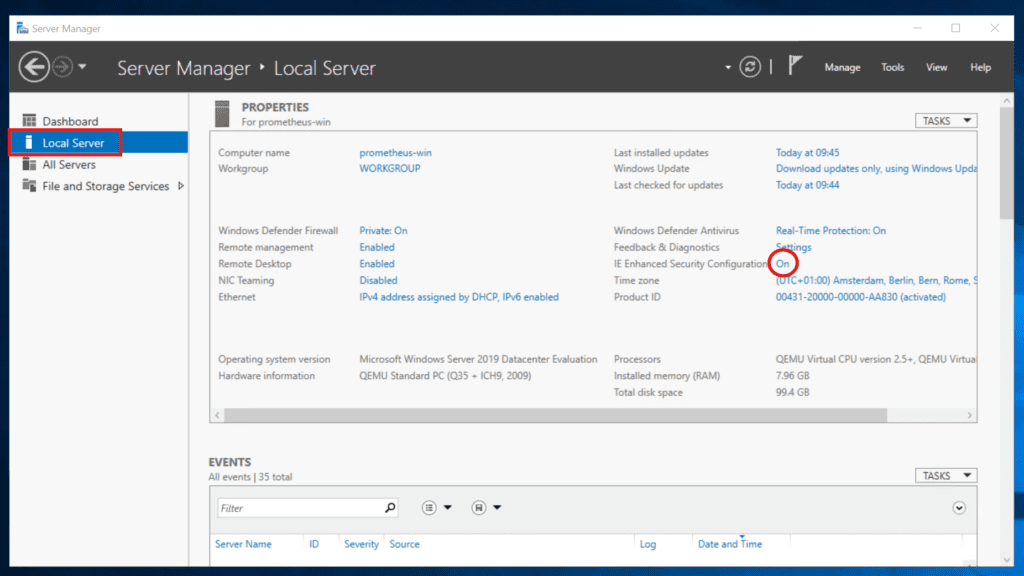
The screenshots provided are from a test server running Windows Server 2019. The subsequent step is optional, but it prevents Windows from sending you alerts for every website you visit. Specifically, it disables the enhanced security feature for Internet Explorer.
- Server Manager -> Local Server -> Disable IE Enhanced Security Configuration
Download required software
- Prometheus
https://prometheus.io/download/
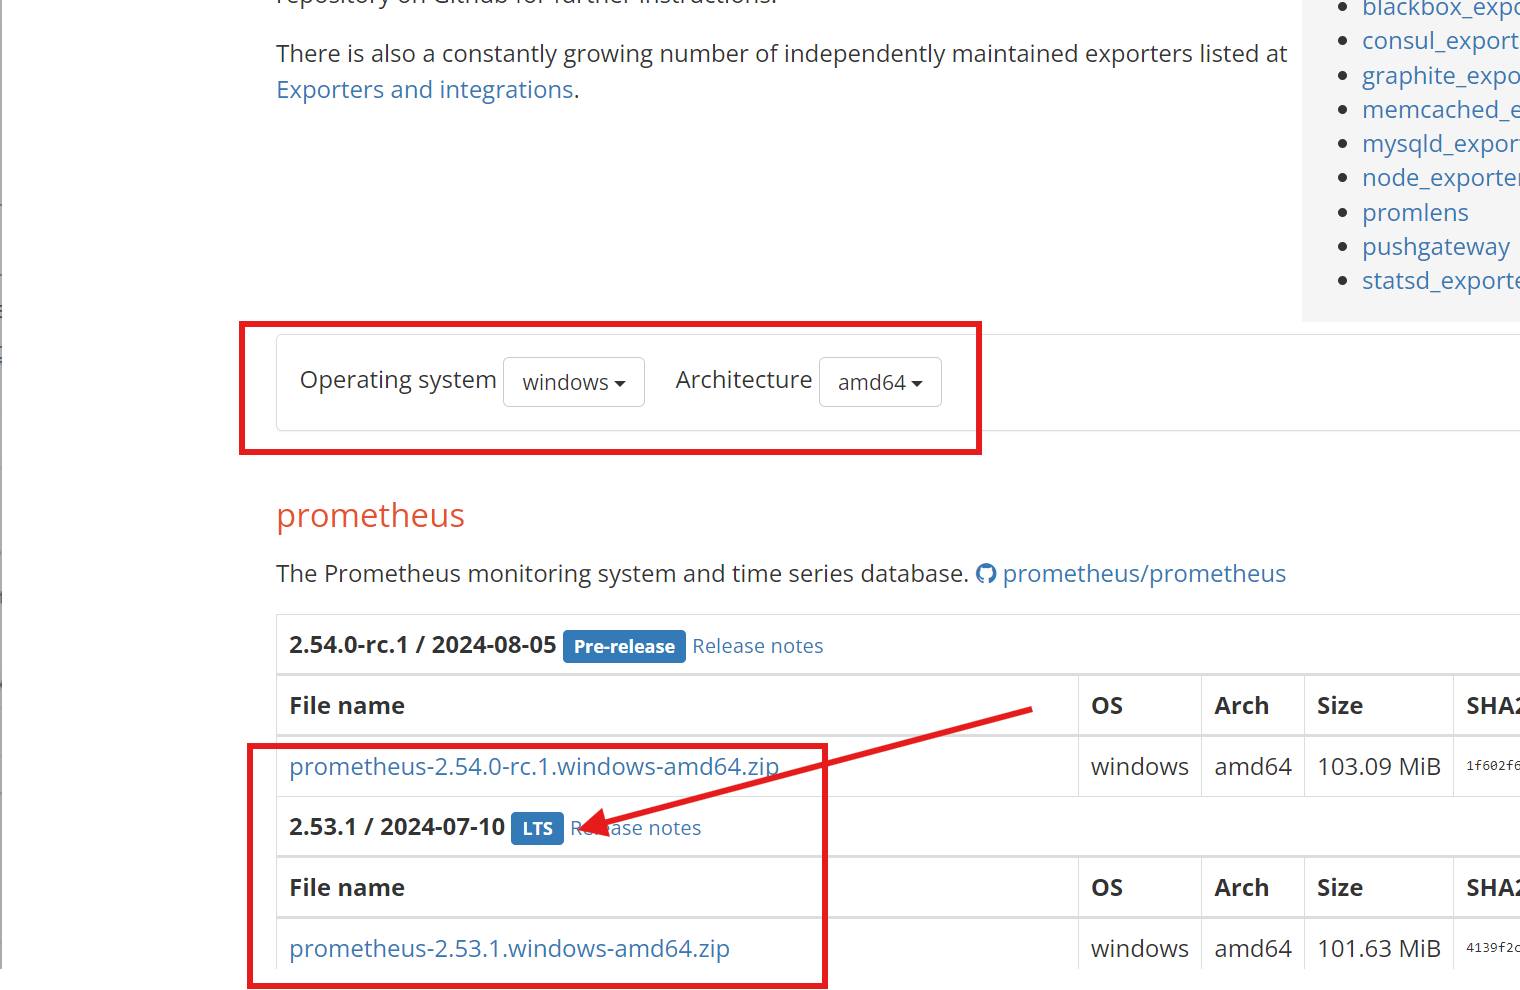
Long-Term Support (LTS) and Release Candidate (RC) are terms used in the software release life cycle.
LTS: Long-Term Support (LTS) is a product lifecycle management policy where a stable release of computer software is maintained for a longer period of time than the standard edition1. This typically involves providing security, maintenance, and sometimes feature updates for a longer duration2. LTS releases are often seen in open-source software and are usually supported for months or years longer than the software’s standard edition1.
RC: A Release Candidate (RC), also known as “going silver”, is a software build that has undergone rigorous testing and is considered feature-complete3. It is a pre-release version of the software, distributed to key stakeholders for final testing and validation3. The RC is a potential candidate for becoming the final stable release4. Ideally, the RC no longer receives any new source code, but production-level testing can sometimes pick up errors4. Fixing these problems and certifying the RC progresses the release life cycle to its final stage4.
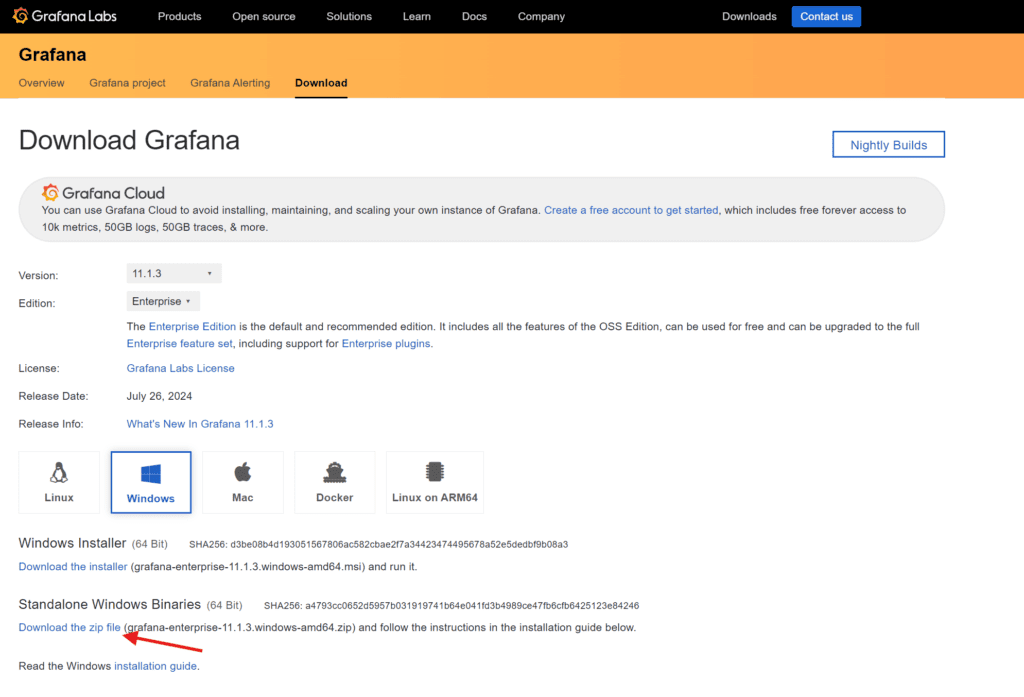
- Grafana
https://grafana.com/grafana/download?platform=windows
Create dedicated Folder or Drive for easy backup and maintenance
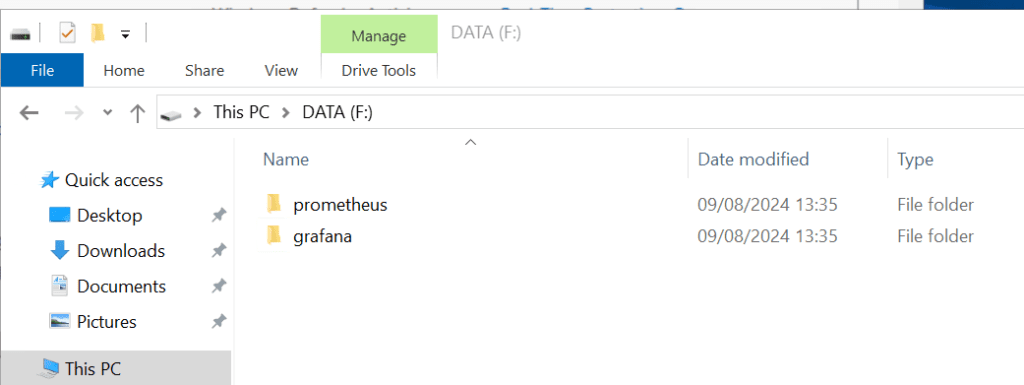
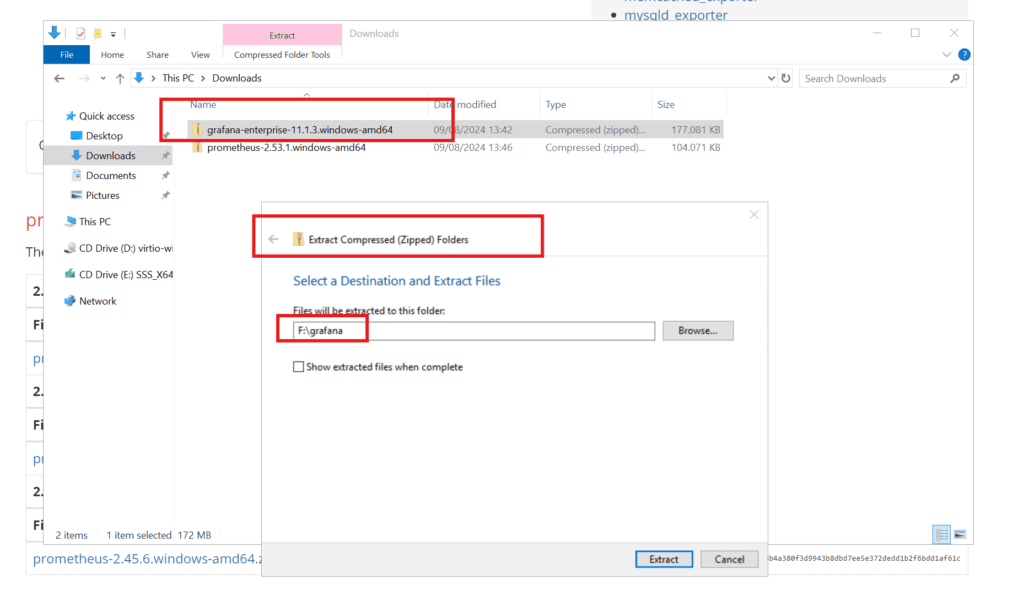
Extract both software’s to desired respective folders
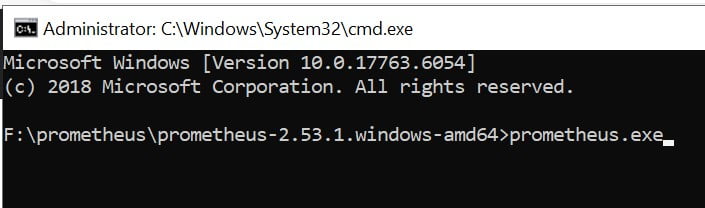
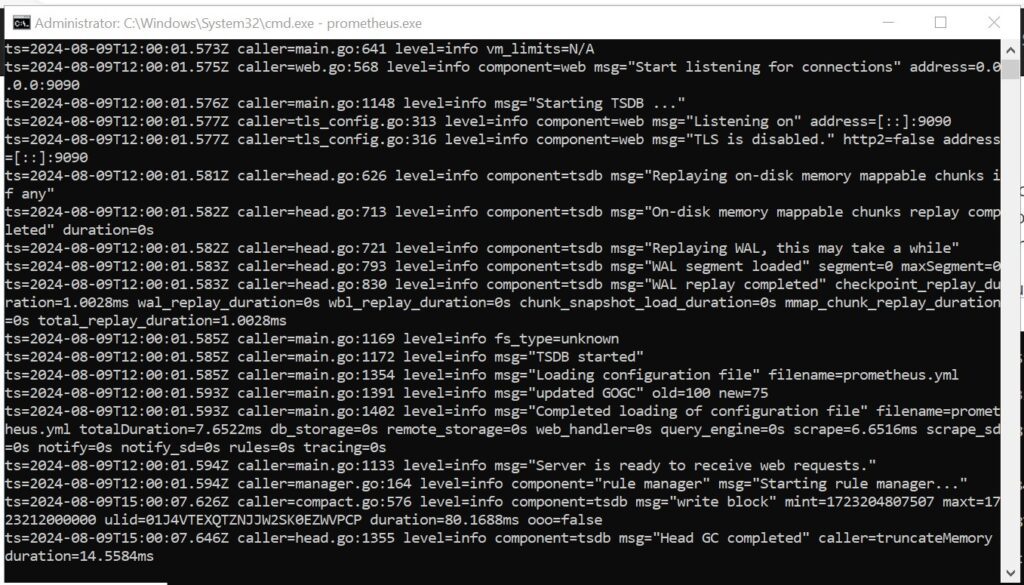
Test Prometheus (no parameters)
Just run from cmd Prometheus.exe
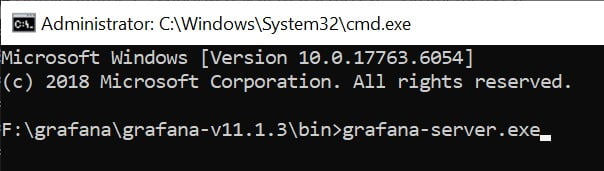
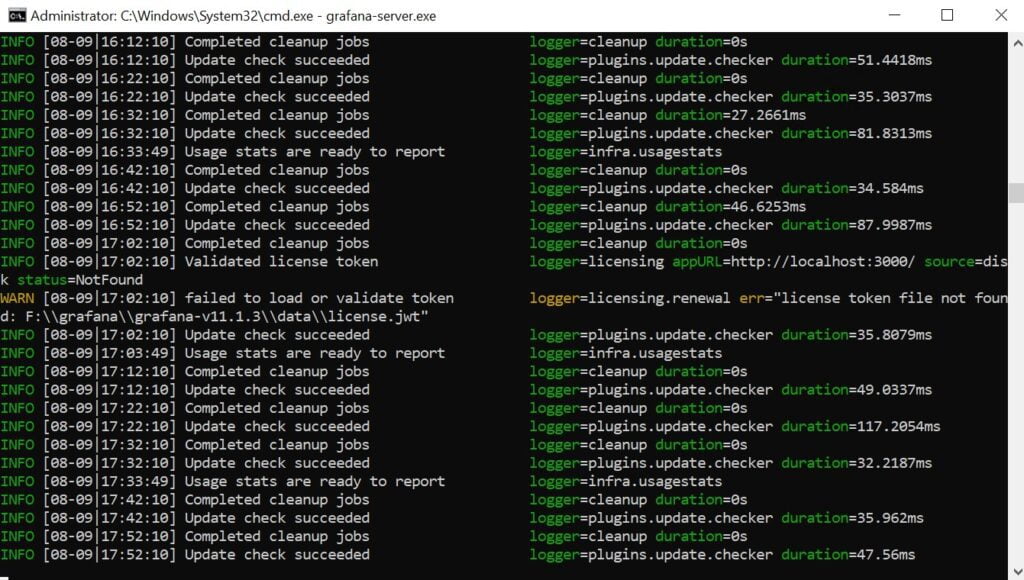
Test Grafana (no parameters)
Just run grafana-server.exe and give it 5 mins to boot up the first time. Log on with Admin/admin and set your password from the default user.
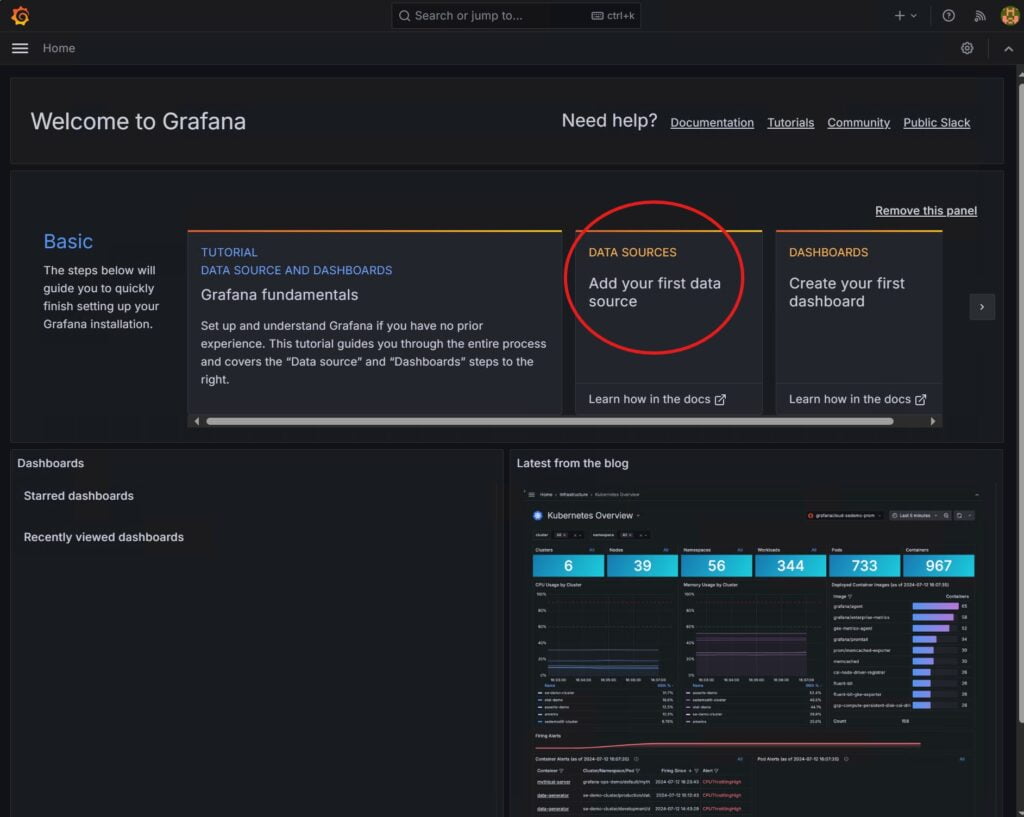
First Login to Grafana
Login to Grafana via https://localhost:3000 or remotely via https://<yourhostname, fqdn or IP address>:3000 with the default credentials Admin/admin
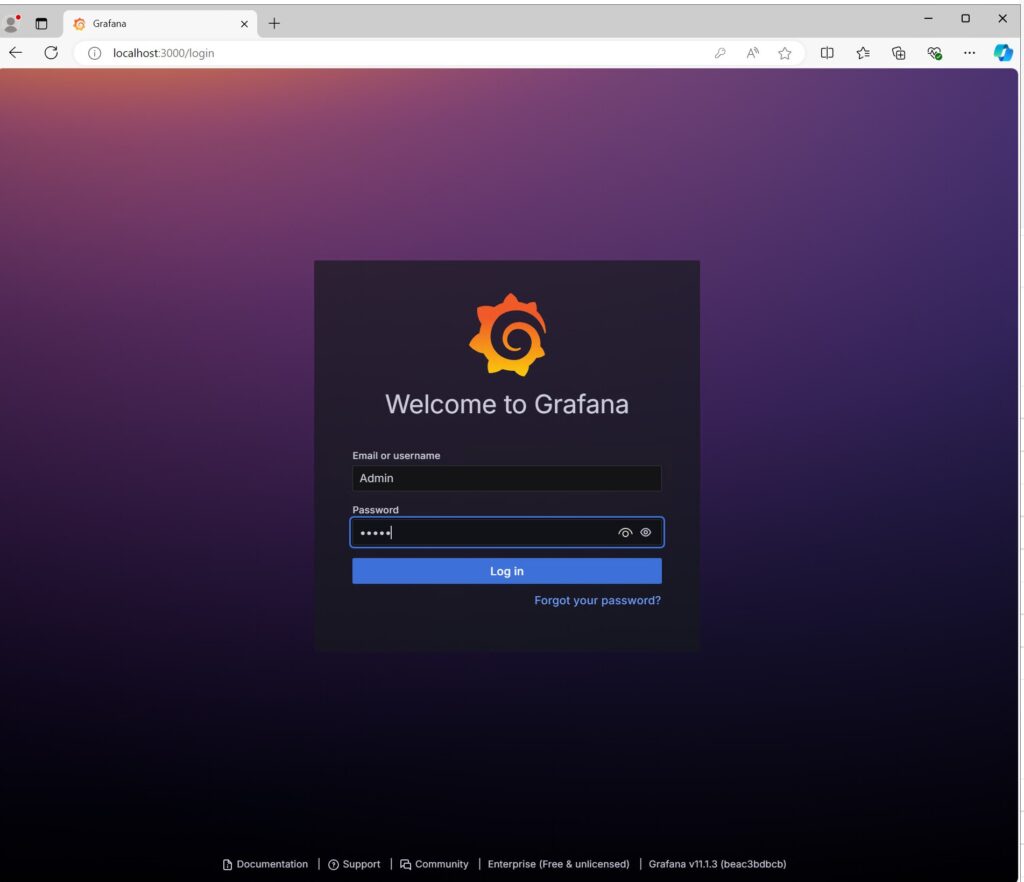
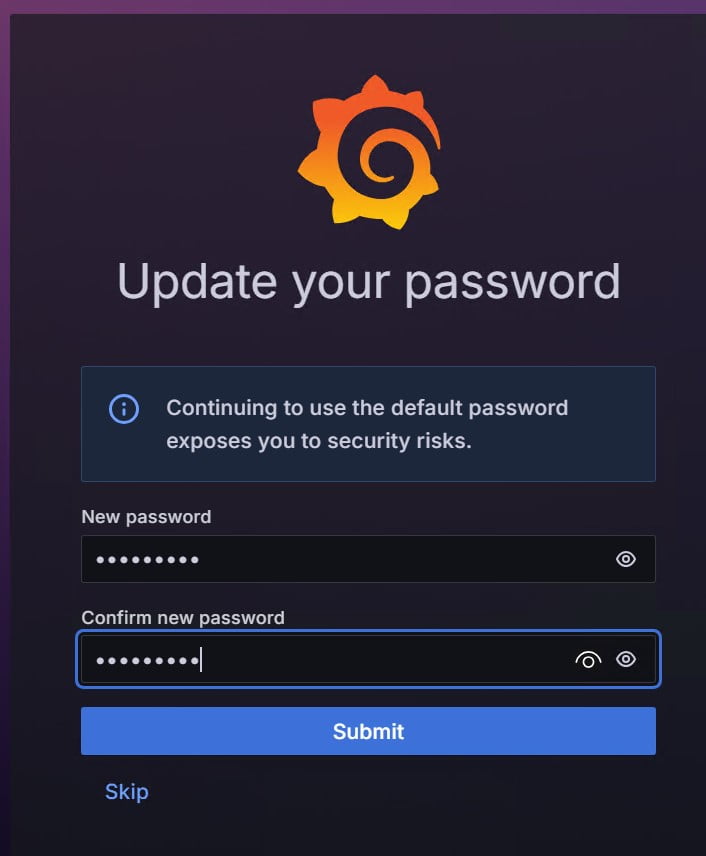
Setup your own password
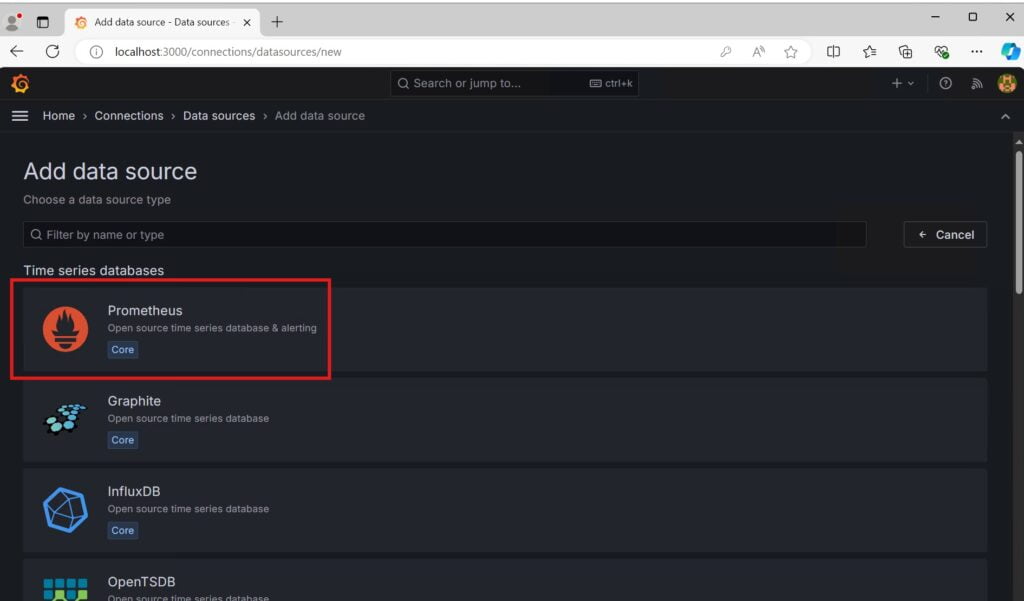
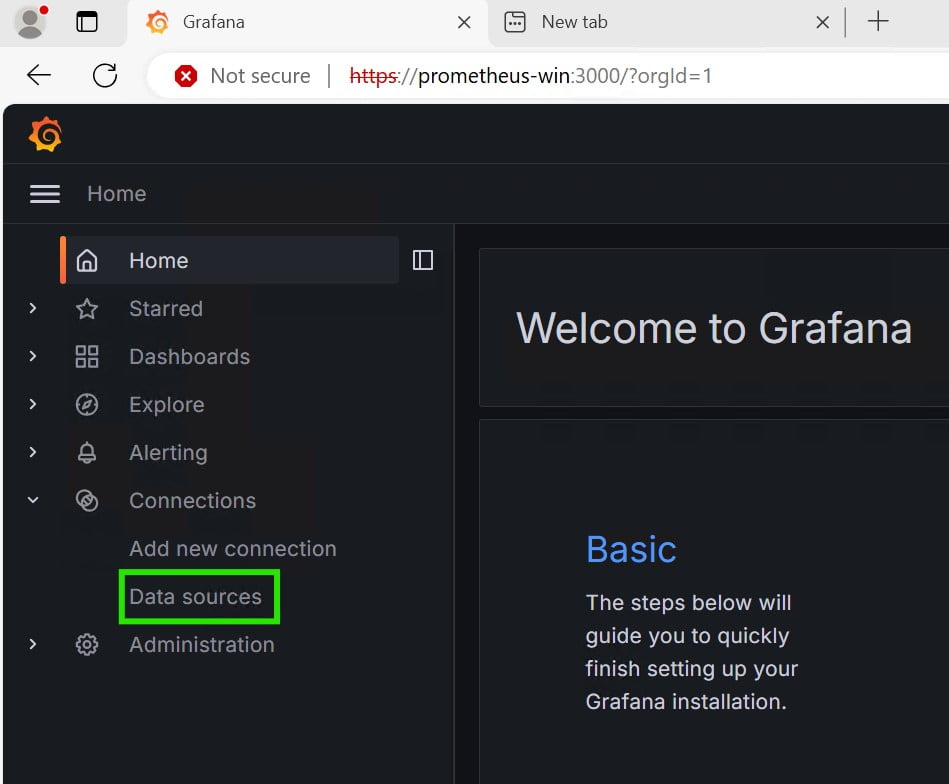
Connect Grafana to Prometheus as a Datasource
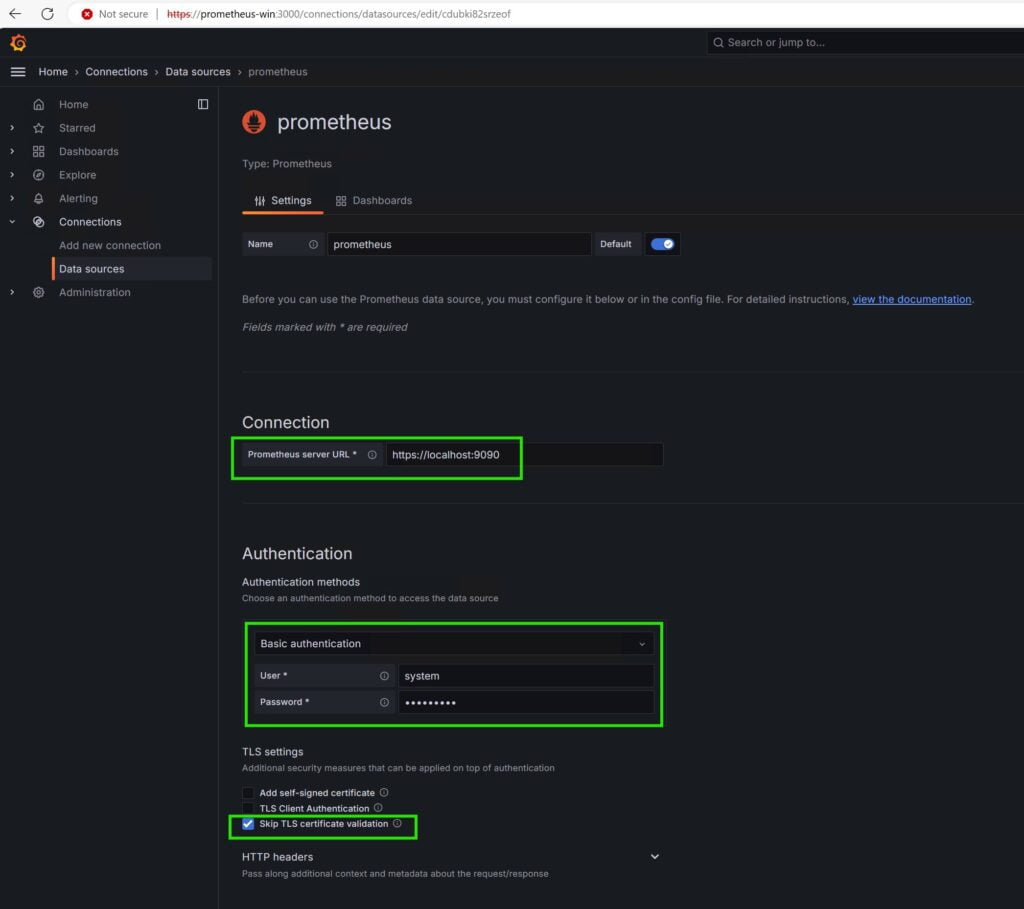
Add your prometheus server URL
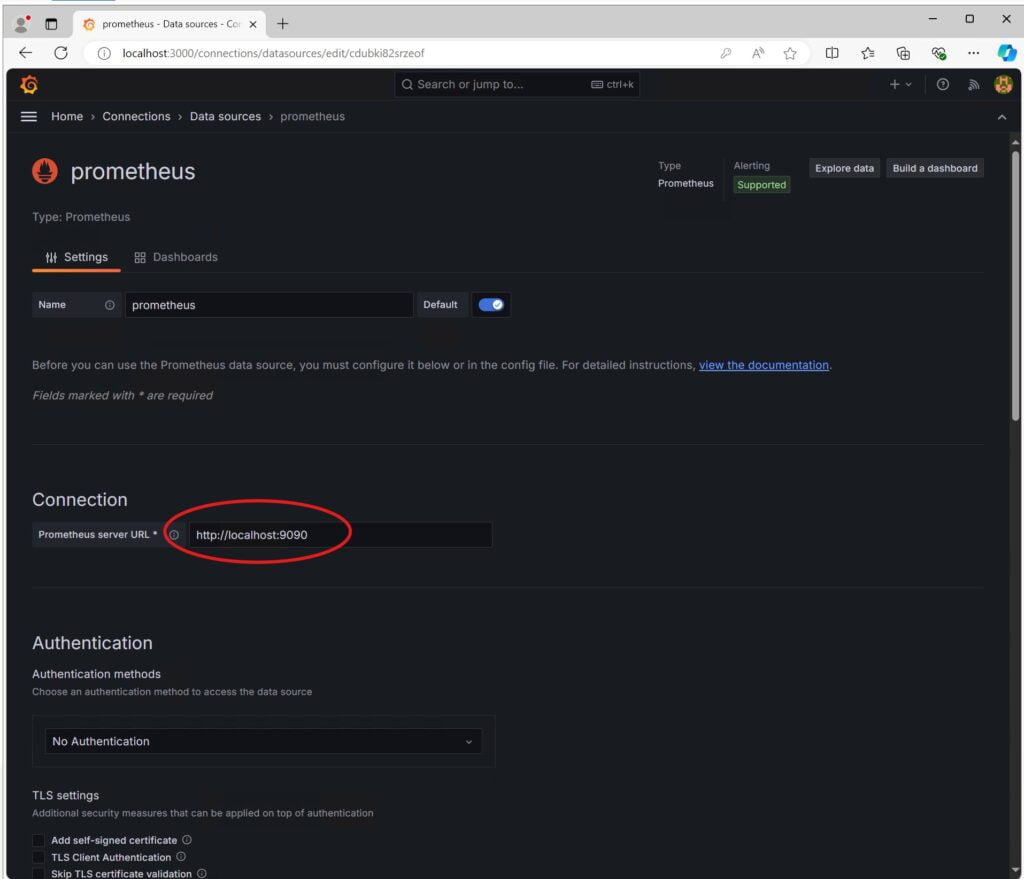
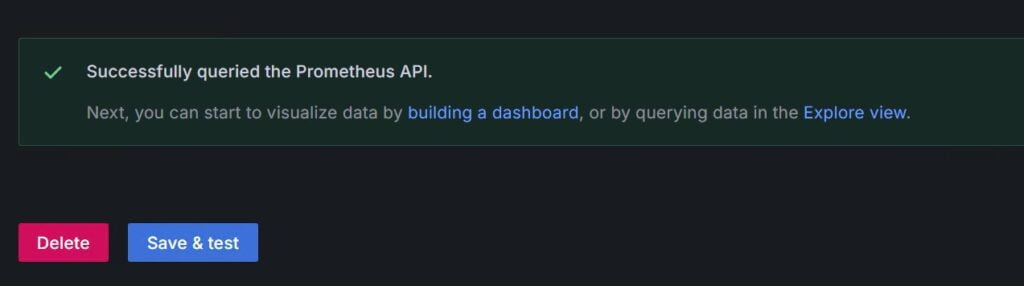
Down at the bottom you can test the connection
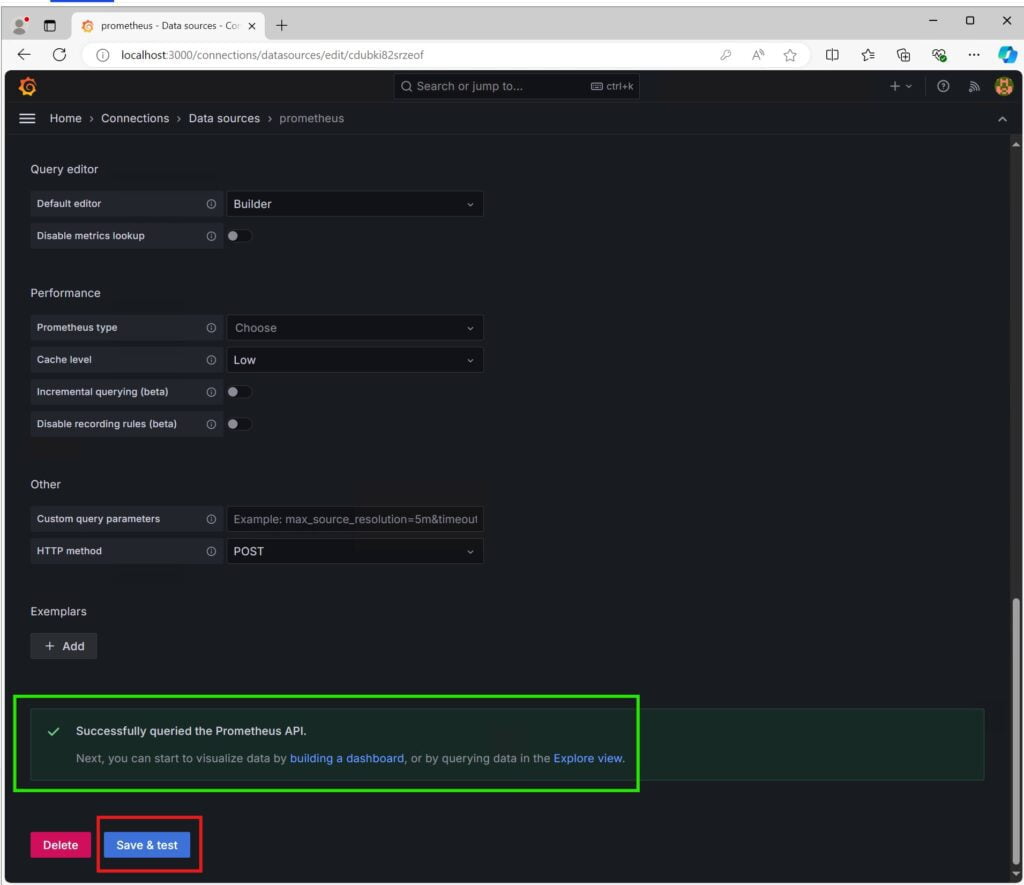
Congratulations! You’ve successfully set up Grafana and Prometheus Server. Our next step is to secure these endpoints and enforce TLS 1.3 by generating a self-signed certificate. To begin, we’ll terminate both executables in their respective CMD sessions using the Ctrl + C command.
These commands collectively enable and enforce the use of TLS 1.3 on your Windows Server. Please ensure to run these commands in an elevated PowerShell session (Run as Administrator).
New-Item 'HKLM:\\SYSTEM\\CurrentControlSet\\Control\\SecurityProviders\\SCHANNEL\\Protocols\\TLS 1.3\\Server' -ForceNew-ItemProperty -Path 'HKLM:\\SYSTEM\\CurrentControlSet\\Control\\SecurityProviders\\SCHANNEL\\Protocols\\TLS 1.3\\Server' -Name 'Enabled' -Value '1' -PropertyType 'DWord'New-ItemProperty -Path 'HKLM:\\SYSTEM\\CurrentControlSet\\Control\\SecurityProviders\\SCHANNEL\\Protocols\\TLS 1.3\\Server' -Name 'DisabledByDefault' -Value '0' -PropertyType 'DWord'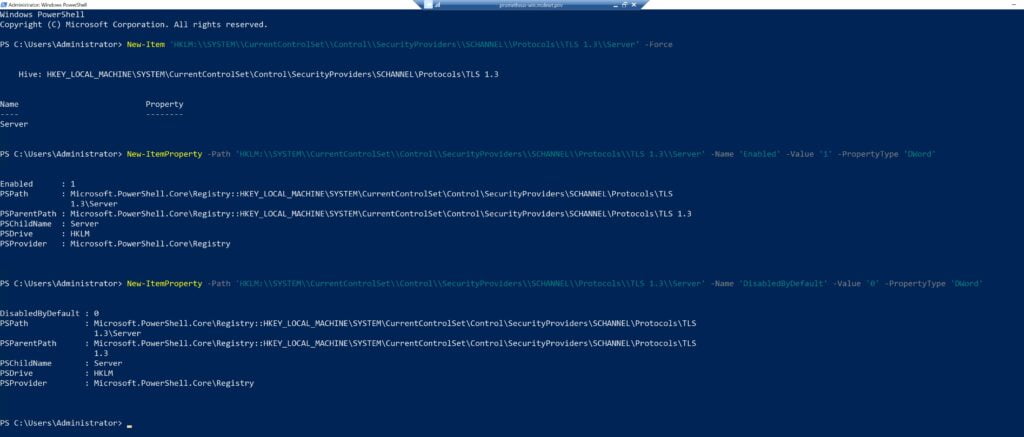
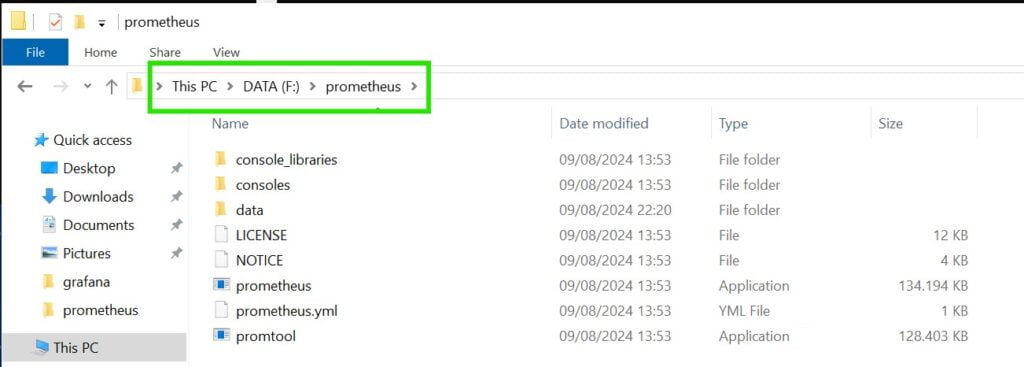
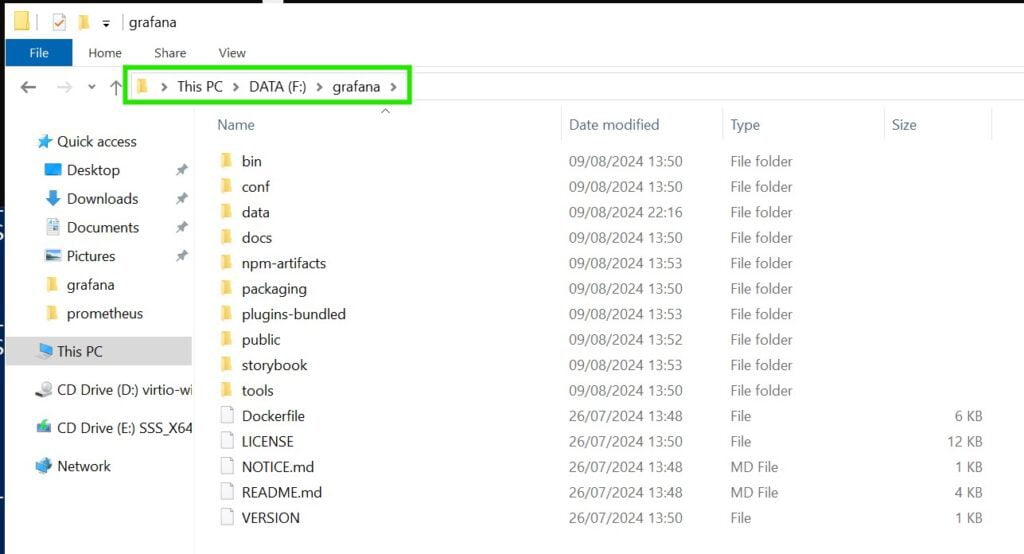
Reorganize folders
Since we will not be conserned with keeping default folder names that were generated through the extraction process we will move everything one folder down. So the content of F:\prometheus\prometheus-2.53.1.windows-amd64 will be moved back down to F:\prometheus\. Same for Grafana.
Generate Certs
Open a Powershell CLI and run the following adapting file paths and DNS names (in bold)
$cert = New-SelfSignedCertificate -CertStoreLocation Cert:\LocalMachine\My -DnsName "prometheus-win", "192.168.1.30" -FriendlyName "prometheus-win" -NotAfter (Get-Date).AddYears(10)

$thumbprint = $cert.Thumbprint

New-Item -ItemType Directory -Path "F:\prometheus\certs"

$thumbprint | Out-File "F:\prometheus\certs\thumbprint.txt"

$thumbprint = Get-Content "F:\prometheus\certs\thumbprint.txt"

$pwd = ConvertTo-SecureString -String "Pr0m3th3us" -Force -AsPlainText

Export-PfxCertificate -Cert "Cert:\LocalMachine\My\$thumbprint" -FilePath "F:\prometheus\certs\certificate.pfx" -Password $pwd

Set-ExecutionPolicy Bypass -Scope Process -Force; [System.Net.ServicePointManager]::SecurityProtocol = [System.Net.ServicePointManager]::SecurityProtocol -bor 3072; iex ((New-Object System.Net.WebClient).DownloadString('https://chocolatey.org/install.ps1'))

##REBOOT REQUIRED NOW###

choco install openssl

###OPEN NEW POWERSHELL + you will be prompted password####

openssl pkcs12 -in "F:\prometheus\certs\certificate.pfx" -clcerts -nokeys -out "F:\prometheus\certs\certificate.crt"

openssl pkcs12 -in "F:\prometheus\certs\certificate.pfx" -nocerts -nodes -out "F:\prometheus\certs\private.key"
Here’s what each command does:
$cert = New-SelfSignedCertificate -CertStoreLocation Cert:\LocalMachine\My -DnsName "prometheus-win", "192.168.1.30" -FriendlyName "prometheus-win" -NotAfter (Get-Date).AddYears(10)- This command creates a new self-signed certificate with the DNS names “prometheus-win” and “192.168.1.30”. The certificate is stored in the local machine’s certificate store and is valid for 10 years.
$thumbprint = $cert.Thumbprint- This command retrieves the thumbprint of the newly created certificate and stores it in the
$thumbprintvariable.
- This command retrieves the thumbprint of the newly created certificate and stores it in the
New-Item -ItemType Directory -Path "F:\prometheus\certs"- This command creates a new directory at the specified path to store the certificate files.
$thumbprint | Out-File "F:\prometheus\certs\thumbprint.txt"- This command writes the thumbprint of the certificate to a text file in the newly created directory.
$thumbprint = Get-Content "F:\prometheus\certs\thumbprint.txt"- This command reads the thumbprint from the text file and stores it back in the
$thumbprintvariable.
- This command reads the thumbprint from the text file and stores it back in the
$pwd = ConvertTo-SecureString -String "Pr0m3th3us" -Force -AsPlainText- This command converts the plain text string “Pr0m3th3us” to a secure string and stores it in the
$pwdvariable.
- This command converts the plain text string “Pr0m3th3us” to a secure string and stores it in the
Export-PfxCertificate -Cert "Cert:\LocalMachine\My\$thumbprint" -FilePath "F:\prometheus\certs\certificate.pfx" -Password $pwd- This command exports the certificate with the specified thumbprint to a PFX file, using the secure string as the password.
Set-ExecutionPolicy Bypass -Scope Process -Force; [System.Net.ServicePointManager]::SecurityProtocol = [System.Net.ServicePointManager]::SecurityProtocol -bor 3072; iex ((New-Object System.Net.WebClient).DownloadString('https://chocolatey.org/install.ps1'))- This command sets the execution policy to bypass for the current process, enables TLS 1.2 as a security protocol, and then downloads and executes the Chocolatey installation script from the specified URL. (reboot required)
choco install openssl- This command uses Chocolatey to install OpenSSL.
openssl pkcs12 -in "F:\prometheus\certs\certificate.pfx" -clcerts -nokeys -out "F:\prometheus\certs\certificate.crt"- This command uses OpenSSL to convert the PFX file to a CRT file, which contains the public key but not the private key.
openssl pkcs12 -in "F:\prometheus\certs\certificate.pfx" -nocerts -nodes -out "F:\prometheus\certs\private.key"- This command uses OpenSSL to extract the private key from the PFX file and save it to a separate KEY file.
These commands collectively create a self-signed certificate, export it to a PFX file, convert the PFX file to a CRT file and a KEY file, and store all these files in a specified directory. They also install OpenSSL if it’s not already installed. Please ensure to run these commands in an elevated PowerShell session (Run as Administrator).
Prometheus HTTPS and TLS 1.3 Configuration Steps
Create a web-config.yml configuration file under the root folder of your prometheus installation. With this configuration, Prometheus will serve all its endpoints behind TLS1.3 and be protected by basic authentication via https://bcrypt-generator.com/. Here is an example web-config.yml configuration file:
tls_server_config:
 cert_file: F:\prometheus\certs\certificate.crt
 key_file: F:\prometheus\certs\private.key
 min_version: "TLS13"
basic_auth_users:
  system: $2a$12$o0UkGmDJvkZcEqd0pe0Wy.mD75UAYtMoIR/NJTmNaByw9C/oBGRK6
Once the file is saved you can try starting the prometheus server as before from cmd but adding a parameter. This is the command if you are already located in that folder.
prometheus.exe --web.config.file=F:\prometheus\web-config.ymlNow if you call the same URL as before but with HTTPS:// instead of HTTP, you will get a prompt:
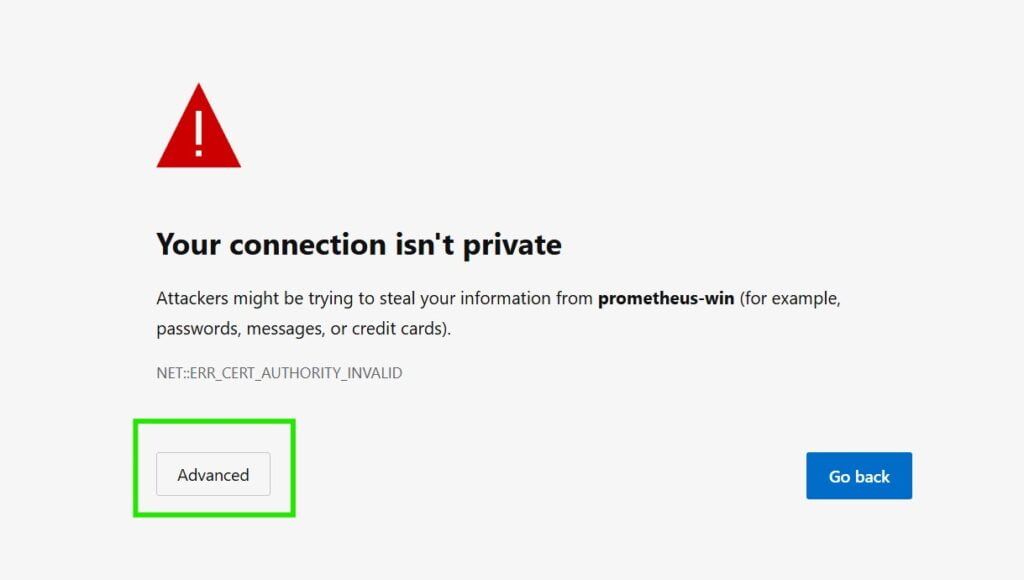
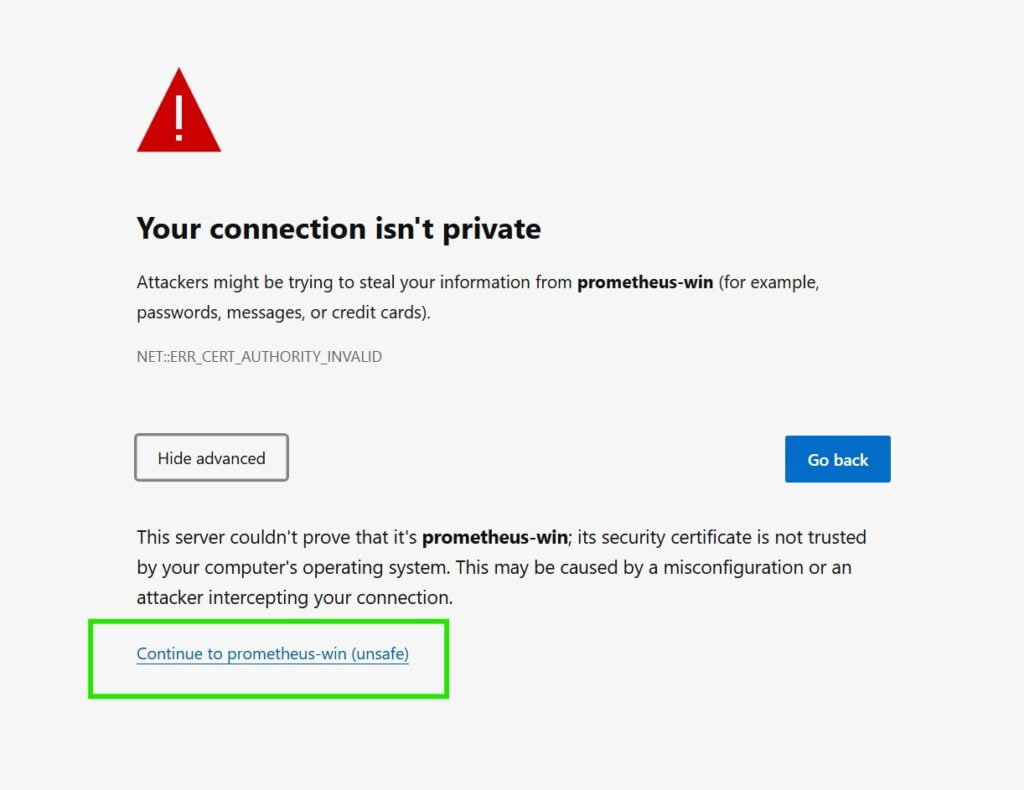
After accepting the risk of accessing prometheus with a self signed certificate you will be prompted to logon:
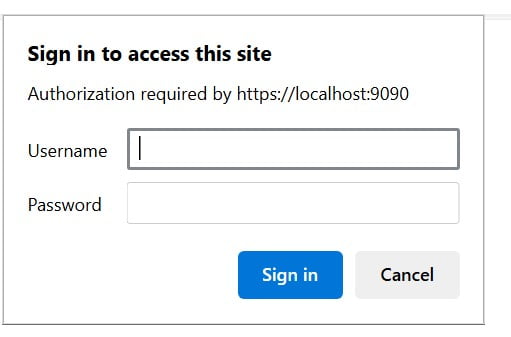
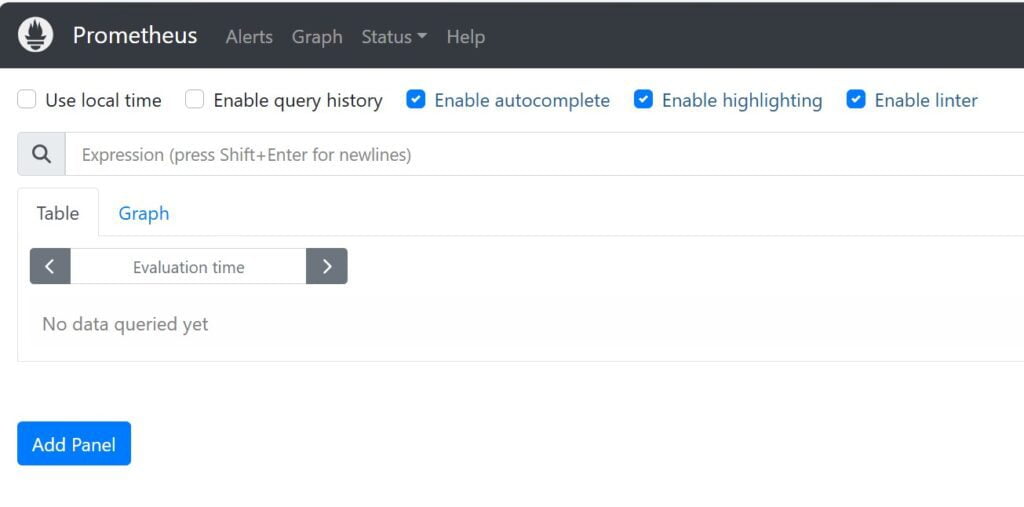
Using the credentials specified in the web-config.yml you will get to the usual Prometheus screen
Grafana HTTPS and TLS1.3 Configuration Steps
Now we will do the same for Grafana, the procedure is faster and we will recycle the same certificate.
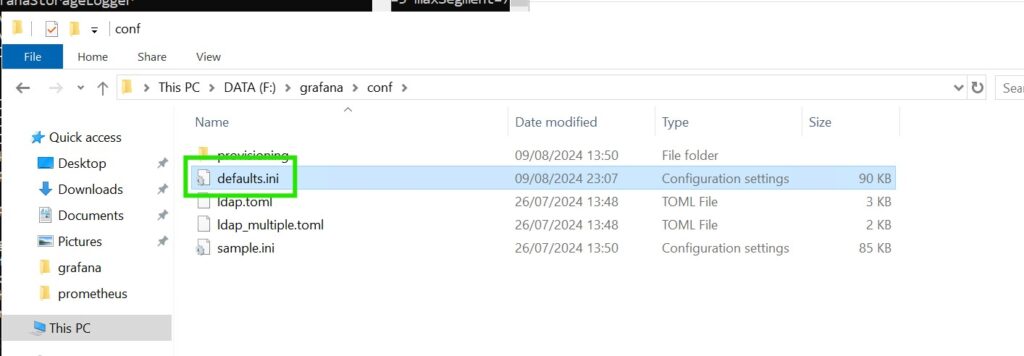
First we need to update the default.ini which is under ../grafana/conf and modify these parameters:
#################################### Server ##############################
[server]
# Protocol (http, https, h2, socket)
protocol = https

# Minimum TLS version allowed. By default, this value is empty. Accepted values are: TLS1.2, TLS1.3. If nothing is set TLS1.2 would be taken
min_tls_version = "TLS1.3"

# The public facing domain name used to access grafana from a browser
domain = prometheus-win

# https certs & key file
cert_file = F:\prometheus\certs\certificate.crt
cert_key = F:\prometheus\certs\private.key
Now you can start grafana as before and login.
Reconfigure Datasource Prometheus with HTTPS and Basic Authentication
We will now modify our data source connection.
Select your Prometheus connection and update the following:
Do a Save and Test.
Congratulations! You’ve successfully installed a secure and robust monitoring stack with TLS 1.3. Stay tuned for our upcoming post, which will guide you through the process of installing and securing windows_exporter/node_exporters with TLS 1.3. On the server side, we’ll be adding these new endpoints and creating two dashboards using pre-existing templates for your convenience.
Install Prometheus and Grafana as a Windows Service
Download NSSM from the official website and unzip where you like. You just need to open a cmd session in that directory and run the following (service will auto start on boot by default)
 nssm install Prometheus F:\prometheus\prometheus.exe --web.config.file=F:\prometheus\web-config.yml
 nssm install Grafana F:\grafana\bin\grafana-server.exe
What is nssm?
nssm stands for Non-Sucking Service Manager. It is a utility designed to manage Windows services, particularly for applications that were not originally designed to run as a Windows service. Unlike the standard sc.exe command, which is used to create and manage Windows services, nssm provides a more reliable and user-friendly way to wrap a regular executable (like Prometheus) as a service.
Why nssm is Useful
Running a non-native Windows application (e.g., a command-line tool or script) as a Windows service using sc.exe can be challenging due to several reasons:
- Service Timeout Issues: Windows expects services to start up quickly and report their status back to the Service Control Manager (SCM). If a service takes too long to start or doesn’t properly signal that it has started, Windows may kill the process, assuming it has failed to start.
- Graceful Handling: Many command-line applications do not handle service control requests (like stop, pause, and restart) natively. This can lead to services hanging or being abruptly terminated, causing data loss or corruption.
- Lack of Feedback:
sc.exedoesn’t provide robust feedback mechanisms, making it difficult to diagnose problems when a service fails to start correctly.
How nssm Helps
nssm addresses these issues by:
- Monitoring the Application:
nssmmonitors the wrapped application and manages its interaction with Windows. It ensures that Windows is correctly informed when the application starts, runs, and stops. - Handling Service Control Signals:
nssmcan send stop, pause, and restart signals to the application, allowing it to respond appropriately, even if the application doesn’t natively support such controls. - Automatic Restarts: If the application crashes or fails,
nssmcan be configured to automatically restart it, improving service reliability. - Simplified Configuration:
nssmprovides a user-friendly GUI to configure the service, making it easier to set up and manage compared to usingsc.execommands. - Logging and Error Handling:
nssmcan redirect the output and error logs of the application to specified files, which simplifies troubleshooting.
Common Use Cases for nssm
- Running Non-Service Applications: Developers and administrators often use
nssmto run applications that don’t have built-in support for Windows services (like Prometheus, Node.js apps, Python scripts, etc.) as services. - Improving Reliability:
nssmis favored when the service must be highly reliable, as it provides robust error handling and restart mechanisms. - Better Control and Monitoring: For applications that need to be started and monitored in a controlled way,
nssmensures better integration with the Windows service management framework.
Installation and Usage
- Installation:
nssmis a standalone executable that doesn’t require installation. You just download it, extract it, and place it somewhere on your system (C:\nssm, for example). - Usage: To use
nssm, you simply runnssm installfollowed by the name of the service and the path to the executable you want to run as a service. A GUI then allows you to configure the service properties, such as start parameters, working directory, logging, and more.
Conclusion
In summary, nssm is a powerful tool that simplifies the process of running non-native Windows applications as services. It overcomes the limitations of sc.exe by providing more robust service management features, better control over the application’s behavior, and improved reliability in keeping the application running as a Windows service. This makes it particularly useful for managing services like Prometheus, which may not integrate seamlessly with the native Windows service management system.
We appreciate your support and encourage you to check out our YouTube channel. Your subscription and comments not only help our website and channel grow, but they also provide valuable insights into potential integrations we might need to incorporate. Thank you for your continued support, and we look forward to bringing you more useful content.