The 2026 Open-Source Observability Landscape: Ranking the Top Five Infrastructure Monitoring Solutions

As the technological landscape matures into the latter half of 2026, the paradigm of infrastructure observability has definitively shifted from static, threshold-based monitoring to dynamic, AI-assisted, and edge-native intelligence. The open-source community has responded to escalating enterprise demands by delivering platforms that rival, and frequently exceed, the capabilities of commercial alternatives. This evolution is driven by the widespread adoption of OpenTelemetry, the integration of Large Language Models (LLMs) via Machine Context Protocol (MCP) servers, and the necessity to manage hyper-scaled, multi-cloud environments.
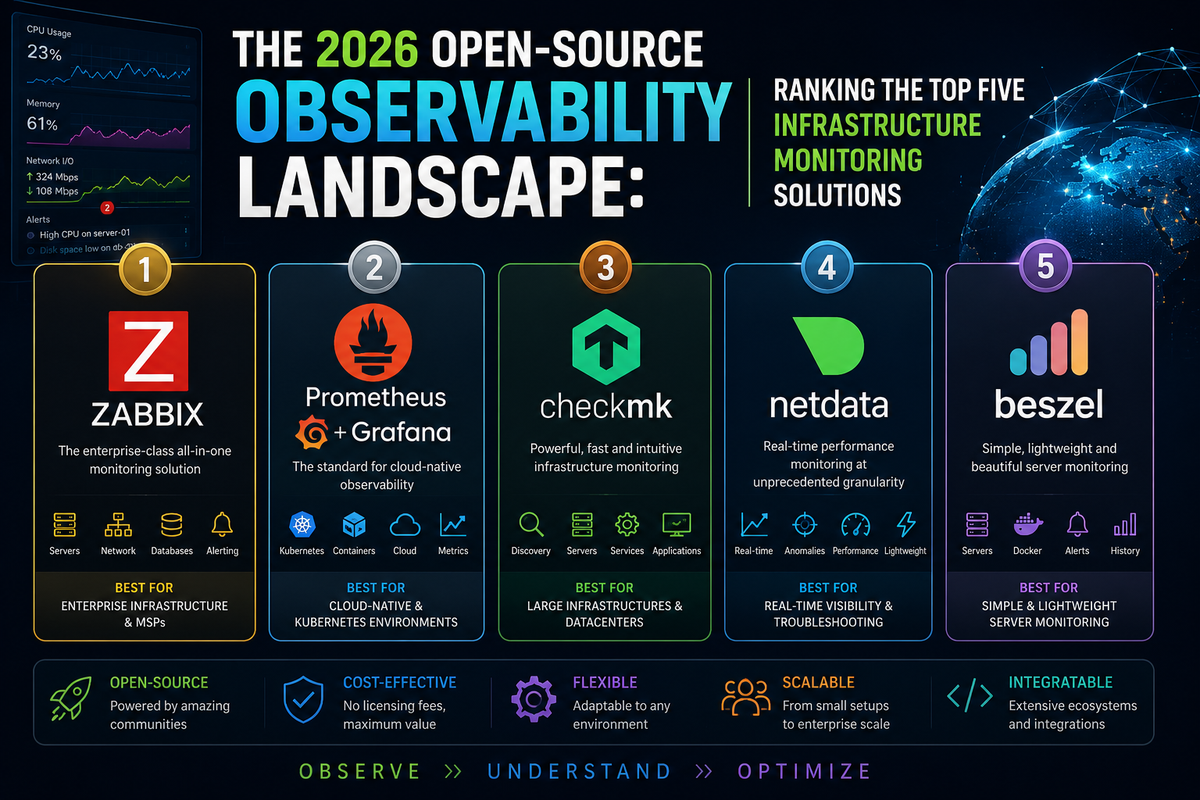
An exhaustive evaluation of the open-source monitoring ecosystem in 2026—based on maturity, feature depth, scalability, community ecosystem, and real-world adoption—reveals a clear hierarchy of platforms. This analysis categorizes these solutions to assist enterprise architects, system administrators, and Managed Service Providers (MSPs) in architecting optimal observability stacks.
Before delving into the technical architecture and features of each platform, it is critical to understand the macroeconomic and regulatory forces shaping the adoption of these open-source tools in 2026.
Market Dynamics: Regulation, MSP Economics, and the Open-Source Shift
The selection of a monitoring platform in 2026 is no longer solely an engineering decision; it is heavily dictated by regulatory compliance and the evolving economics of managed IT services.
The Impact of NIS2 and DORA on Observability
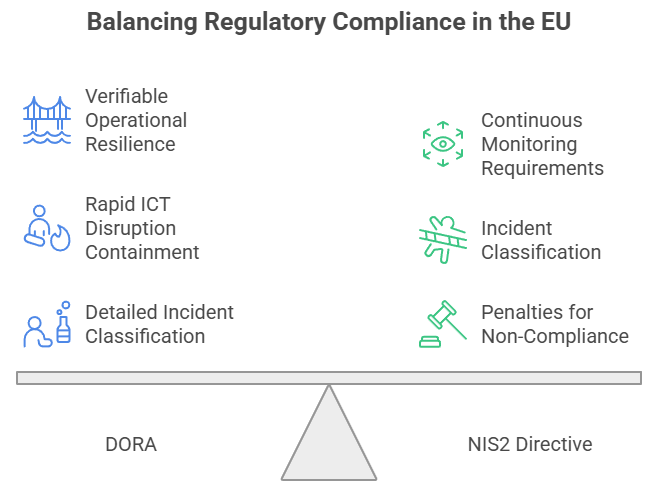
In the European Union and across global entities interacting with the European market, regulatory frameworks have redefined operational resilience. The Digital Operational Resilience Act (DORA), which became effective for EU financial entities and ICT third-party providers on January 17, 2025, mandates verifiable operational resilience, rapid containment of ICT disruptions, and detailed incident classification. Similarly, the NIS2 Directive entered active EU supervision following its October 2024 transposition deadline, introducing mandatory continuous monitoring requirements and exposing organizations to penalties of up to €10 million or 2% of global turnover for non-compliance.
These regulations require infrastructure monitoring to serve as a cornerstone of compliance. Organizations must produce evidence of uptime, dependency maps, and incident timelines for audits. Consequently, modern monitoring platforms must provide continuous data collection and early detection, offering real-time visibility into system behavior and identity access, thereby reducing the time between anomalies and detection. Furthermore, blast-radius detection and root-cause analysis have become legal necessities; organizations must be able to explain how an incident originated, progressed, and which assets were affected to satisfy reporting mandates. Finally, open-source, self-hosted tools have seen a surge in adoption because they allow enterprises to keep metric data strictly on-premises, avoiding the compliance complexities associated with routing sensitive telemetry through external SaaS vendors.
The Evolution of the Managed Service Provider (MSP) Market
The European MSP market alone is forecast to grow from €120 billion in 2025 to €220 billion by 2030, driven by businesses outsourcing cloud management, cybersecurity, and compliance operations. As MSPs scale, they face severe margin pressures from commercial software licensing. Commercial Remote Monitoring and Management (RMM) and observability stacks can cost an MSP between $50,000 and $200,000 over three years, utilizing volume-based pricing that penalizes growth.
Conversely, deploying an enterprise-grade open-source stack reduces this three-year Total Cost of Ownership (TCO) to between $15,000 and $40,000, even when factoring in implementation, training, and support overhead. Open-source solutions eliminate per-client licensing fees, allowing MSPs to onboard unlimited clients with predictable margins. This economic reality has led to the widespread professionalization of open-source monitoring within MSP environments, demanding tools that support true multi-tenancy, Role-Based Access Control (RBAC), and API-driven automation.
🥇 1. Zabbix: The Benchmark for Traditional Infrastructure
Zabbix retains its position as the undisputed benchmark for traditional and hybrid infrastructure monitoring. Approaching the release of its 8.0 Long Term Support (LTS) version in Q3 2026, Zabbix has successfully bridged the gap between legacy polling mechanisms and modern observability. It is the platform widely trusted to monitor an entire corporate IT estate comprehensively.
Architectural Maturity and Scalability
Zabbix's architecture is uniquely suited for massive scale and complex topologies. Utilizing a central server backed by high-performance proxy polling, it easily accommodates hundreds of thousands of monitored devices. The introduction of proxy groups and a permission-based visibility model in recent 2026 builds ensures high availability and horizontal scaling. This architecture enables automatic failover and load balancing across geographically distributed networks. For MSPs, this proxy architecture provides perfect tenant isolation and secure traversal of customer firewalls without requiring bidirectional public internet exposure. Additionally, Zabbix has introduced native database High Availability (HA) with automatic failover for PostgreSQL backends, ensuring the central repository remains resilient against node failures.
2026 Capabilities and the 8.0 LTS Roadmap
The transition from Zabbix 7.4 to 8.0 LTS introduces a paradigm shift in how Zabbix handles telemetry. Recognizing the industry shift toward standard protocols, Zabbix is actively developing cloud-native, scalable collection and processing of OpenTelemetry data, complete with tracing data visualization. To support this, Zabbix 8.0 introduces a new storage engine explicitly optimized for streaming telemetry, time-series data, and logs, moving beyond traditional relational database bottlenecks.
Furthermore, Zabbix has heavily invested in event correlation and enterprise alarm management. A new Complex Event Processing (CEP) engine provides advanced event correlation, filtering, deduplication, time-window logic, and custom JavaScript pattern matching. This engine positions Zabbix as a lightweight Security Information and Event Management (SIEM) tool capable of fraud detection, automated incident remediation, and log-based observability.
On the artificial intelligence front, the official Zabbix MCP (Model Context Protocol) server allows AI agents to programmatically query monitoring data, manage alerts, and access configuration states directly. This facilitates AI-powered automation, allowing large language models to assist engineers in diagnosing complex outages. From an enterprise security standpoint, Zabbix has hardened external secret storage via HashiCorp Vault AppRole authentication, added CSV audit log exports, and introduced direct UI-based SSO certificate management to cater to the strictest compliance requirements.
🥈 2. Prometheus + Grafana Labs: The Standard for Modern Observability
While Zabbix dominates traditional hardware and virtualized infrastructure, the combination of Prometheus and Grafana remains the undeniable standard for modern, cloud-native observability. Almost every Kubernetes, microservices, and containerized environment defaults to this metrics-first architecture.
| Core Competencies | Architectural Focus |
| Kubernetes & Containers | Native orchestration monitoring via PromQL |
| Cloud & Microservices | High-cardinality label scraping for ephemeral workloads |
| Developer Ecosystem | Deep integration with CI/CD and developer pipelines |
| Metrics-First Monitoring | Unmatched pull-based metric scraping efficiency |
Prometheus 3.0: The Architectural Leap
Following its massive 3.0 release—the first major version boundary since 2.0 in 2017—Prometheus modernized its core engine. The platform transitioned to default UTF-8 support, allowing metric names with dots, dashes, and non-ASCII characters to render correctly. The legacy Bootstrap UI was entirely replaced with a modern React-based Mantine UI, incorporating a PromLens-style tree view for sub-expression visualization and a rich Metrics Explorer.
Under the hood, Prometheus 3.0 delivered clear efficiency gains. The introduction of string interning—where unique strings are stored once in a symbols array and subsequent references use integer indices—resulted in 60% fewer bytes on the wire, 90% fewer memory allocations, and 70% lower CPU usage during compression. Furthermore, classic Prometheus histograms, which required pre-defined bucket boundaries that often broke dashboards when changed, have been superseded. Prometheus 3.0 supports Native Histograms with automatic exponential-growth boundaries, allowing a single series to replace numerous bucket series while supporting out-of-order ingestion, which is critical for OpenTelemetry data.
Grafana 12/13: Advanced Visualizations and GitOps
Grafana Labs has heavily innovated on the visualization and operational front throughout 2025 and 2026. The release of Grafana 13 solidifies "Dynamic Dashboards" as the standard, allowing teams to consolidate views dynamically based on data sources.
Crucially for enterprise deployments, Grafana's native Git Sync allows teams to manage dashboards as JSON files stored in GitHub or GitLab. This enforces version control and integrates seamlessly into GitOps workflows, blurring the boundary between platform administration and application code. Grafana now includes SQL expressions to manipulate data source query results directly, allowing data from heterogeneous sources (like Prometheus, MySQL, and BigQuery) to be combined into single views.
The Grafana Kubernetes Monitoring Helm chart (v4) also received a complete restructuring. Previously, version 3 caused significant memory bloat because it applied all Kubernetes pod labels and annotations as log labels in bulk, forcing the Alloy collector to allocate memory for hundreds of labels only to discard most of them via a labelsToKeep list. Version 4 removes this entirely, requiring users to explicitly declare which labels to promote. Furthermore, the v4 chart separates cluster, host, and cost metrics into explicit maps, making multi-cluster GitOps workflows highly reliable and eliminating hard-coded collector names.
🥉 3. Checkmk: A Favorite Among Experienced Sysadmins
Checkmk occupies a highly strategic space, offering a unified platform that is universally favored by experienced system administrators. It successfully bridges the gap between Zabbix's steep configuration curve and Prometheus's cloud-centric focus, providing one of the fastest paths to comprehensive IT visibility. It is often cited as easier to get comprehensive infrastructure monitoring running than relying on Prometheus alone.
| Core Competencies | Architectural Focus |
| Outstanding Auto-Discovery | Instantly maps services without manual intervention |
| Very Scalable | Distributed architecture utilizing Livestatus |
| Excellent Linux/Windows Support | Highly efficient, self-contained native agents |
| Strong Network Device Support | Deep SNMP and API integration out-of-the-box |
Intelligent Auto-Discovery and Scale
Checkmk's defining feature is its rule-based, intelligent auto-discovery. Using highly efficient, self-contained agents that require minimal CPU and RAM (and no external dependencies like DLLs), Checkmk instantly maps out thousands of services across servers and networks. Its distributed monitoring architecture operates via a Livestatus broker. This allows hundreds of remote sites to operate autonomously; if the connection to the central node fails, the local monitoring continues operating normally without losing data or generating alert queues, and generates virtually zero network traffic between the central and remote sites during normal operation.
The 2.4 and 2.5 Evolution
As Checkmk transitions through version 2.4 into its 2.5 release (April 2026), it has significantly modernized its data ingestion capabilities. Checkmk can now natively ingest OpenTelemetry protocol metrics directly from applications, and scrape Prometheus /metrics endpoints without requiring an intermediary Prometheus server, drastically simplifying hybrid observability.
In Checkmk 2.4, dynamic host management was completely restructured. The new architecture separates the connectors—which generate host data—from the processing cycle that manages host updates, service discovery, and the activation of changes. Because these connectors now operate independently and in parallel, they feed data into a sequential host processing cycle, preventing interference and ensuring much smoother operations during bulk discovery. Furthermore, Checkmk expanded its piggyback mechanism—which allows the platform to use agent data provided by a source host for a different receiver host. In distributed setups, connected sites can now exchange piggyback data across boundaries, allowing administrators to monitor a piggybacked host on any site.
4️⃣ 4. Netdata: The Real-Time Diagnostic Engine
Netdata offers an unparalleled "wow factor" through its immediate, high-fidelity data visualization. While traditional monitoring tools aggregate data into 30- or 60-second intervals, Netdata focuses on instant troubleshooting by capturing every metric, every second, with sub-2-second latency from collection to visualization.
| Core Competencies | Architectural Focus |
| Per-Second Metrics | Uncovers 2-10 second microbursts invisible to others |
| Process-Level Intelligence | Immediate visibility into CPU, memory, and Disk I/O |
| Network Usage | Granular traffic analysis at the interface level |
| Built-in Anomaly Detection | Edge-native Machine Learning with 18 models per metric |
Edge-Native Machine Learning and Diagnostics
The trade-off with Netdata is that it is more focused on real-time visibility than serving as a centralized, long-term enterprise alarm console like Zabbix. However, as a diagnostic tool, it is unrivaled. Netdata's true differentiator in 2026 is its AIOps and Machine Learning architecture. Instead of centralizing data for cloud ML processing—which incurs massive egress fees and latency—Netdata trains 18 independent ML models per metric directly on the edge node.
Netdata utilizes consensus-based anomaly detection. An anomaly is only flagged when all 18 models unanimously agree, achieving a 99% reduction in false positives compared to single-model, threshold-based alerts. This mathematically transparent, k-means clustering approach is fully auditable, satisfying the EU AI Act's explainability mandates, whereas black-box deep learning models fail compliance audits.
When an incident occurs, Netdata's Anomaly Advisor automatically ranks thousands of metrics, comparing anomaly rates to baselines. This scoring engine surfaces the root cause typically within the top 30-50 results, slashing Mean Time To Resolution (MTTR) by up to 80%. Because it operates on 1-second data collection, it provides 60 times more ML training samples per window compared to minute-level monitoring, allowing it to detect transient anomalies like CPU microbursts or network saturation that cascading failures stem from.
5️⃣ 5. Beszel: The Lightweight Newcomer
Beszel is the rising star of the 2026 monitoring landscape, capturing immense attention for its modern aesthetic and astoundingly small resource footprint. Developed to combat the bloat of traditional observability stacks, Beszel delivers the essentials of server monitoring without the immense overhead.
| Core Competencies | Architectural Focus |
| Very Modern UI | Clean, intuitive dashboard avoiding Grafana's complexity |
| Tiny Resource Footprint | ~10-23 MB RAM footprint per agent |
| Docker-Native | Automatic container discovery and statistic tracking |
| Extremely Easy Deployment | Standalone binaries, WinGet, Scoop, and Docker images |
| Multi-Server Overview | Hub-and-agent model with secure SSH tunneling |
Architecture and Unmatched Efficiency
Beszel operates on a streamlined hub-and-agent model. The agent, written in Go, runs as a standalone binary or Docker container and consumes merely 10 to 23 MB of RAM at idle. In stark contrast, a comparable Prometheus and Grafana stack (including node_exporter and cAdvisor) easily consumes 400 to 700 MB of RAM before processing any significant metric cardinality. This makes Beszel the ideal solution when a user wants something much simpler than Zabbix without sacrificing visibility.
Despite its lightweight nature, Beszel has rapidly matured throughout 2025 and 2026. It automatically discovers and tracks per-container CPU, memory, and network usage for Docker and Podman environments without requiring manual exporter configurations. Recent updates introduced automatic S.M.A.R.T. disk health tracking via sysfs, NVMe capacity reporting, and highly specific GPU collectors spanning Nvidia, AMD, Intel, and Apple Silicon.
From a security perspective, the platform includes built-in OAuth/OIDC support and allows agent/hub communication via secure SSH tunneling (or WebSockets), negating the need to expose public ports on the monitored servers. For deployment, it offers third-party Windows GUI installers, as well as native integrations with Windows package managers like WinGet and Scoop.
Honorable Mentions: Specialized and Legacy Powerhouses
While the top five solutions cater to the broadest infrastructure needs, several other excellent open-source projects rank just outside the top tier, often due to their specialized nature or dated architectures:
- VictoriaMetrics: A fantastic backend for Prometheus metrics, but fundamentally a storage and query engine rather than a complete monitoring platform. However, in 2026, it continues to dominate in hyper-scale Time Series Database (TSDB) performance. Its v1.144 release brought native Prometheus histogram ingestion, multi-level downsampling, Rollup cache metrics, and a dedicated Kubernetes log collector (
vlagent). - Icinga: A modern fork of Nagios with significant improvements, though it has a smaller ecosystem than Zabbix. Mid-2026 releases (v2.16.x) introduced robust SELinux policy support (e.g.,
icingadb_can_connect_allfor TCP event forwarding), PHP 8.5 compatibility, and tight integrations with vSphere and Atlassian Jira. - LibreNMS: Excellent for network monitoring (switches, routers, firewalls), featuring unparalleled auto-discovery via SNMP. It is less comprehensive for general compute infrastructure, but notably includes built-in billing modules for calculating usage-based client charges—a highly lucrative feature for network-centric MSPs.
- Nagios: A pioneer in monitoring, but its architecture and user experience feel dated compared to newer alternatives. Still, its legacy status and thousands of community plugins ensure it remains embedded in countless enterprise environments.
- OpenNMS: Powerful for carrier-grade and telecom environments, offering massive scalability for distributed networks, but it is far more specialized and complex to administer than general-purpose tools.
If I Were Building an MSP in 2026
For architects building a Managed Service Provider (MSP) practice in 2026, relying on a single monolithic tool is often a strategic error. Given the interests in maintaining a low-maintenance MSP while handling enterprise infrastructure and strict regulatory compliance (NIS2/DORA), the optimal strategy involves a composite open-source stack. This combination provides broad coverage—from simple VPS monitoring to large enterprise environments—without forcing every customer onto the same level of complexity.
- Zabbix as the primary monitoring platform: Deploy Zabbix as the centralized fault-management and alerting backend. Its proxy architecture allows the MSP to place a lightweight polling engine inside each client's network, securely traversing NAT and firewalls. The HashiCorp Vault integrations and granular user permissions guarantee the strict tenant isolation required by modern compliance frameworks.
- Grafana for advanced dashboards and reporting: Connect Grafana directly to Zabbix and other backend data sources. Using Grafana's GitOps capabilities, an MSP can push standardized, branded reporting dashboards to all clients, providing the high-level executive visibility needed for SLA reporting and compliance auditing.
- Beszel for small customers: For micro-clients, standalone web servers, or small businesses who want a lightweight, low-cost solution, deploy the Beszel agent. It provides immediate, zero-maintenance visibility into host health and Docker containers without consuming the client's limited compute resources or requiring complex proxy setups.
- Netdata as an on-demand troubleshooting tool: Install Netdata on mission-critical client databases and application servers. When an alert fires in Zabbix, senior engineers can transition to Netdata for deep, real-time diagnostics. Its edge-native ML and AI Co-Engineer allow operators to bypass hours of manual log parsing to achieve rapid incident containment.
- Prometheus only for specific workloads: Reserve Prometheus strictly for customers running Kubernetes, cloud-native workloads, or highly ephemeral microservices. Its unmatched pull-based scraping and native histogram support are essential here, and the data can be seamlessly piped back into the central Grafana dashboard.
This tiered approach eliminates the financial burden of commercial software licensing while delivering a highly resilient, compliance-ready observability framework. Organizations that adopt this multi-faceted strategy in 2026 will achieve total infrastructure visibility, transforming monitoring from an operational cost center into a decisive competitive advantage.