A Step-By-Step Guide to Installing and Configuring Grafana on Red Hat-Based Linux Distributions
Introduction
Grafana is a powerful web dashboard tool used for visualization and monitoring of various data sources. Whether you’re a system administrator or a data analyst, Grafana can be an invaluable tool for creating interactive and customizable dashboards to visualize your data. In this blog post, we’ll walk you through the process of installing and configuring Grafana on Red Hat-based Linux distributions.
Step 1: Installation
To get started with Grafana, you need to install it on your Red Hat-based Linux system.
Open your terminal and run the following command to install Grafana using your distribution’s package manager. For Red Hat Enterprise Linux, CentOS, or Fedora, you can use “dnf.” For CentOS, make sure to enable the EPEL repository if it’s not already enabled:
sudo dnf -y install grafana This command will download and install Grafana on your system.
Step 2: Configuration
Once Grafana is installed, the next step is to configure it to suit your needs. Grafana uses a configuration file to specify settings like the protocol, IP address, port, domain, and SSL certificate. You can edit this configuration file using a text editor of your choice. Here, we’ll use “vi” to edit the Grafana configuration file:
Open the configuration file using “vi” or your preferred text editor:
sudo vi /etc/grafana/grafana.iniWithin the configuration file, you can customize various settings to match your requirements. For example, you can specify the IP address and port on which Grafana should listen. You can also configure SSL certificates if you want to secure your Grafana instance.
Step 3: Start and Enable Grafana
After configuring Grafana, it’s time to start and enable it as a service, so it runs automatically on system boot. Use the following command to achieve this:
sudo systemctl enable --now grafana-serverThis command will start the Grafana service and configure it to start on system boot.
Step 4: Accessing Grafana
With Grafana installed and running, you can now access it through a web browser. Open your browser and navigate to the following URL:
http://(Grafana server's hostname or IP address):3000/Replace “(Grafana server’s hostname or IP address)” with the actual hostname or IP address of your server where Grafana is installed.
Step 5: Configure Firewalld
If you are using firewalld on your Red Hat-based Linux system, it’s crucial to allow access to the Grafana service ports. By default, Grafana runs on port 3000. To enable access to this port, follow these steps:
Open your terminal and run the following commands to add port 3000 to the firewalld rules:
firewall-cmd --add-port=3000/tcp success This command allows incoming traffic on port 3000 for the Grafana service.
If you want these changes to persist across system reboots, run the following command to make the rule permanent:
firewall-cmd --runtime-to-permanent success This command ensures that the port 3000 rule remains active even after a system restart, making it a permanent part of your firewall configuration.
Configuring firewalld in this manner is essential to ensure that Grafana can be accessed from other machines on your network. With the appropriate firewall settings, you can securely access your Grafana dashboards and visualize your data from anywhere in your network.
Step 6: Logging In and Changing Password
The initial login to Grafana uses the default “admin” user with the password “admin.” It’s crucial to change this password immediately for security reasons. Here’s how you can do it:
- Enter “admin” as the username and “admin” as the password to log in.
- After logging in, you’ll be prompted to change the password and then directed to the Grafana Home page.
- If you want to change your password, click on the gear icon in the lower-left corner to access the “Configuration” menu.
- Select “Users” and then click on the “admin” user.
- Under the “Change password” section, enter your current password (“admin”) and your new password.
- Click “Save” to update your password.
Step 7: Adding Prometheus as a Data Source
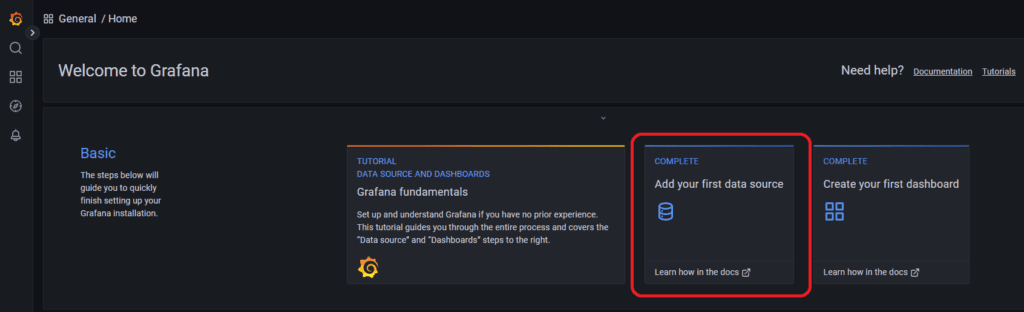
Once logged in, you’ll land on the Grafana Home page. From here, click on “Add your first data source”
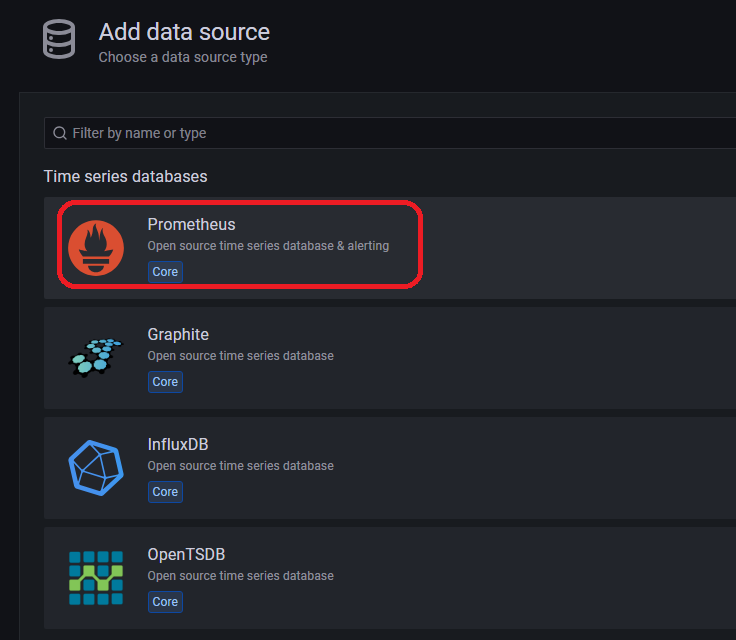
Click on the Prometheus as a data source
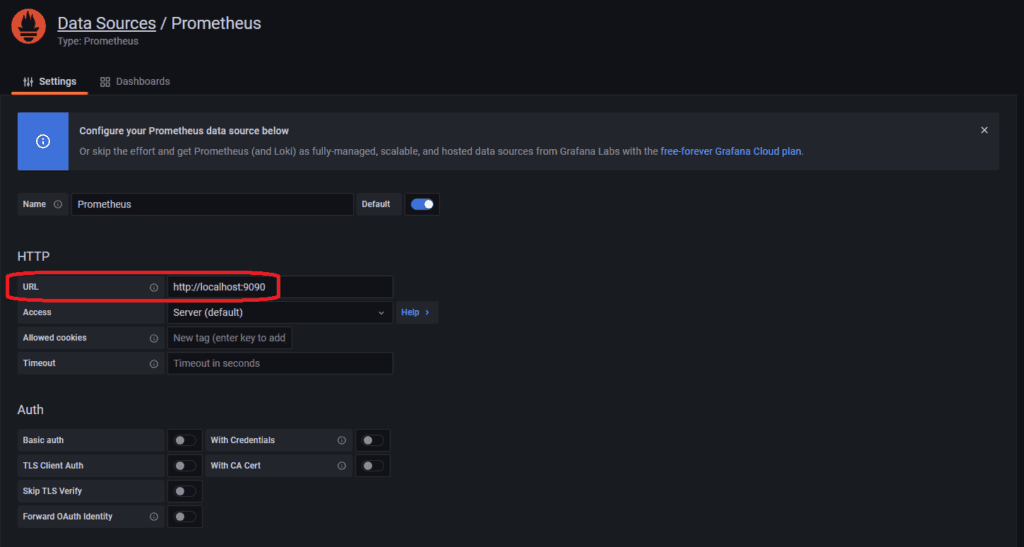
All you have to add is the Prometheus endpoint:
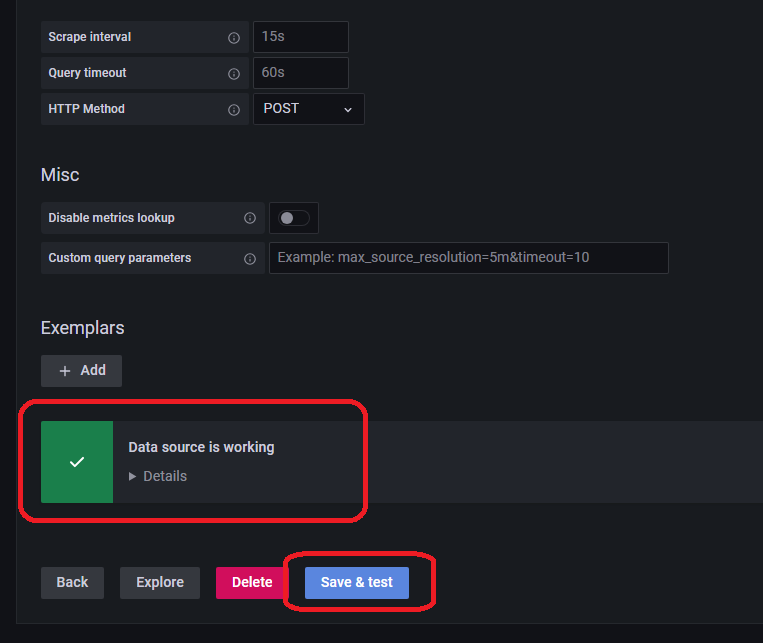
Check if the connection works by clicking on “Save & test”
Step 8: Importing Predefined Dashboards
Now that we have successfully connected Grafana to our Prometheus data source, it’s time to start visualizing the metrics in Grafana. One of the quickest and most convenient ways to get started with Grafana is to utilize predefined dashboards. These dashboards are thoughtfully designed to provide a comprehensive view of server metrics, although you may find that only a subset of these metrics is truly relevant to your monitoring needs.
Here’s how to import a predefined dashboard:
- From the Grafana Home page, click on the “Create” option in the left sidebar.
- Select “Dashboard” to begin the dashboard creation process.
- In the dashboard settings, click on the “Import” option.
- You can choose to import a predefined dashboard by providing its unique ID or by uploading a JSON file. Many community-contributed dashboards are available online and can be imported using their unique IDs.
- After entering the ID or uploading the JSON file, click “Load” to proceed.
- Grafana will fetch and import the dashboard configuration, which includes panels, queries, and visualizations tailored to your specific data source.
- You can further customize the imported dashboard to fit your specific requirements. Modify panel queries, visualizations, and layout as needed.
By importing predefined dashboards, you can kickstart your Grafana experience with a rich set of visualizations that capture a broad range of server metrics. As you explore the dashboard and fine-tune it, you can focus on the metrics that are most critical to your monitoring objectives. This approach saves time and ensures you have an optimal view of your system’s performance.
Check out this Node Exporter Full, you can see all necessary steps and see it in action in the youtube video.
Conclusion
Grafana is an essential tool for data visualization and monitoring, and with this step-by-step guide, you should be well on your way to setting up your Grafana instance on Red Hat-based Linux distributions. Remember to customize the configuration to match your specific needs and, most importantly, change the default password to ensure the security of your Grafana environment. Happy dashboarding!